Software development using Kanban principles has not focused on Effort Tracking (though there hasn’t been a strong position against the same). At Digité, we were practitioners of Iterative Software Development. As part of this process, we emphasized on Daily Effort Tracking (time filing) for several reasons:
- Since we have geographically distributed teams, it helped us get a sense of what happened without chasing individual team members or asking people to send an email with their update.
- A lot of effort based metrics could be accurately computed and relied upon (especially if you have come from the ISO/CMMI world!). For example, we knew how much time was spent in product work (enhancements) vs unproductive work (rework) and see if the trend was in the right direction. We knew how much time was required for essential tasks that were not functionality accretive, like, performance tuning, stack upgrades, etc.
The list can go on…
We adopted Kanban about 8 years back but continued with this practice. We tweaked it a bit to:
a) Dedicate 2-3 minutes every day on filing time before signing off for the day (we strongly discourage Weekly Time filing)
b) Use the previous day’s timesheet report as the basis to cover what was done the previous day across the team (no memory jogging required) in the Daily Status Call. It takes less than 3-5 minutes to discuss this for a team of 10. The rest of the daily call is focused on discussing what will be done today, team goals and specific issues.
One common criticism is the accuracy of such data that can be used for further analysis. However, once the team realizes that people are discussing and looking at this data daily, the accuracy and seriousness creeps in without any follow-up or persuasion.
Kanban focuses on cycle time and throughput (and associated metrics like wait time/ blocked time/ etc.). However, combining actual effort data with cycle time helps get the following additional benefits:
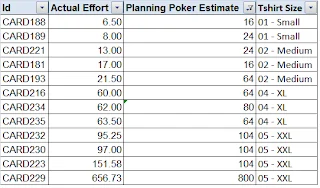
a) Compute the actual effort to complete work of different kinds – defects, user stories of different size (S, M, L, XL, XXL), etc. A sample of our data is below:
b) Publish variance between estimated effort and actual effort to help the participants of the estimation process ee-baseline their “gut-feel” benchmark. We estimate using Planning Poker and hence, the above input helps making future estimates more accurate. As you can see from the sample snapshot below, some of the estimates are quite “off” the actual.
d) It also helps estimate how much time we need to reserve for “other” work buckets – leave/ paid time off, training, engineering tasks like performance, refactoring, etc. and budget for that. A sample data snapshot is enclosed for our team:
This means that at an aggregate level, for our team, close to 50% of the capacity can be earmarked for product enhancements (user stories). However, going by the trend of the last quarter, we can budget close to 70% for the same!
e) Understand if the amount of effort spent on “rework” (Internal Defects + Customer Defects) is improving or deteriorating (thereby pointing towards the need for training, resource upgrades, etc.).
In short, without any significant additional effort or being intrusive, one is able to collect additional data points for better planning and forecasting. These data points are very helpful in aggregate planning and forecasting (beyond what is on the board today or in the backlog).
Sudipta (Sudi) Lahiri
Head of Products and Engineering


