
In every project, be it software development, marketing, or any other project, there exists an intricacy of tasks, resources, objectives, outcomes, and many more. Amidst this complexity, how can we ascertain that our project is progressing as planned? How do we pinpoint areas for improvement? And most importantly, how can we ensure that our decisions are grounded in factual insights?
Especially traditional spreadsheets like Excel can leave you in the dark. While they manage data within the sheet, consolidating information from other sources is a headache. Even worse, Excel dashboards are like static snapshots. They require constant manual updates, making it hard to track progress and identify areas for improvement. This lack of real-time data makes informed decision-making a gamble.
Imagine this: A single screen that tells you exactly how your project is doing. No more hunting through scattered reports or deciphering spreadsheets. This dashboard is your one-stop shop for all things project-related, keeping you informed, your team aligned, and those plates spinning smoothly.
Why should you care?
Because not ditching the Project dashboard means:
☑ No more communication black holes: Everyone sees the same info (people see what they want to, so no confusion about who’s doing what and when.
☑ Problems? We hardly knew them: Spot potential roadblocks way before they slow you down. Transparency is your friend!
☑ Efficiency through the roof: Stop wasting time chasing data. The dashboard has it all, beautifully presented, for quick access.
☑ Decisions based on fact, not fancy: See how your project’s performing in real-time, and make adjustments based on what the data whispers (or shouts!).
☑ Teamwork makes the dream work (and avoids burnout): Keep an eye on everyone’s workload and ensure nobody gets buried (or bored).
Building your dream dashboard is easy
☑ Pick your key players: Identify the metrics that matter most to your project, like completed tasks, bug squashing times, and those fancy burn-down charts.
☑ Keep it chill: Don’t overload the dashboard. Focus on the essentials and present them clearly. Charts and graphs are your friends here – data that pops is easy to understand.
☑ Live updates are a must: Make sure your dashboard is like a fitness tracker – it should always show your current progress, not yesterday’s news.
☑ Customize like a boss: Your dashboard should reflect your project’s unique needs. Pick a tool that lets you play around with the data and visuals to perfectly suit your workflow.
☑ Sprint-friendly: Structure your dashboard around your Agile sprints. Track upcoming tasks, bug fixes within a sprint, and how close you are to nailing those sprint goals.
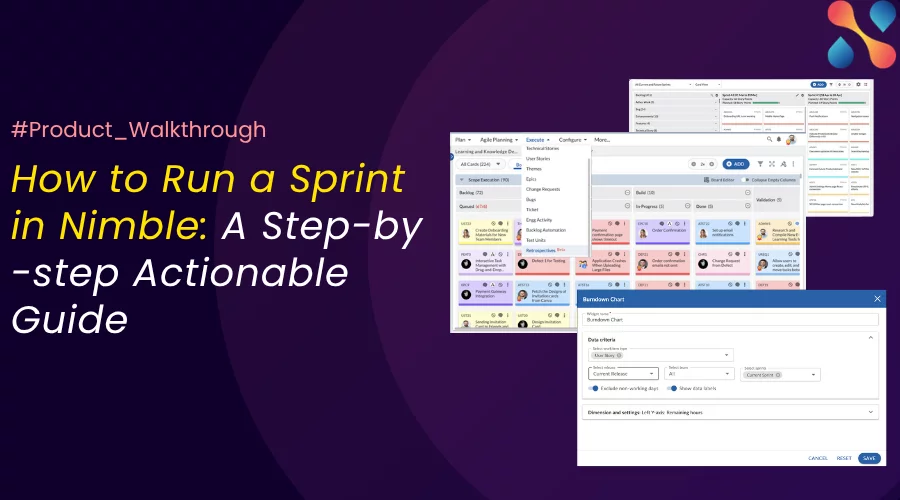
Real-world example: Imagine your project as a car on a road trip and your Nimble dashboard might look like this
☑ Project health Analytics: Project health analytics is like the dashboard that tells you if you’re on track. It shows things like how much gas you have left (work remaining) and how fast you’re going (progress).

☑ Burn Down Chart: This is like a gas gauge that shows how much work is left based on time. The lower the line, the closer you are to your destination (project completion).

☑ Velocity Trends: Think of this as your car’s average speed on previous trips (sprints). It helps guess how far you can get on the next leg (upcoming sprint).

☑ Card Aging: Ever forget something’s in the back seat? Card aging highlights tasks that haven’t been touched in a while. It’s like nudging you to check if those forgotten tasks are still relevant.

☑ Defect Metrics: These are like warning lights for critical bugs. They help you identify and fix any major issues before they stall your progress.

Summary
In the fast-paced world of project management, where every decision can make or break your success, the power of real-time dashboards cannot be overstated. By leveraging tools like Nimble, you’re not just upgrading your project management game, you’re revolutionizing how your team operates, capable of navigating challenges with ease and delivering high-quality results on time. With a clear view of key metrics, proactive identification of roadblocks, and streamlined communication among team members, you pave the way for efficient collaboration and informed decision-making. Take a 30-day Free trial of Nimble.