Swiftly Interactive Demo

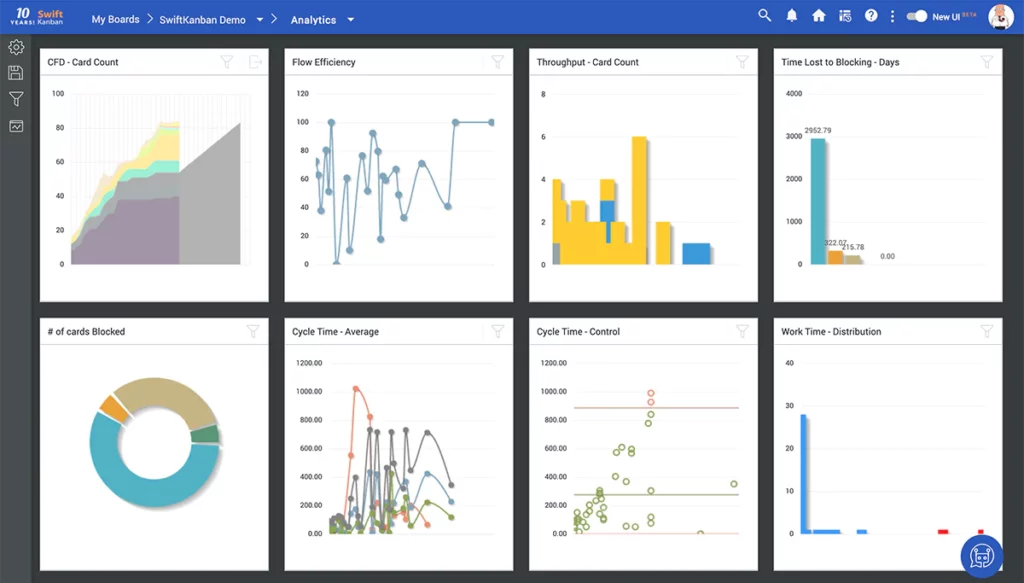
Switch between the various tabs to see the various aspects of your data


Cumulative Flow Diagram (CFD)
The Cumulative Flow Diagram (CFD) provides a graphic depiction of how cards are moving through various statuses on the way to being ‘Done’. It shows us the total scope of a board, grouped by status, and thus lets us know how much of that scope is in a particular status at a given time. The CFD in SwiftKanban helps to track the performance of the board and how close you are to completing the board on a whole.
Unlock Powerful and Actionable Insights!
Try Swiftly Professional for 30 Days!


