
In this article, we will help you understand The Flag Data Analyzer.
|
Skip Ahead to: Key features of the Flag Data Analyzer Flag Data Analyzer at the Organization Level |
Overview
The Flag Data Analyzer is a powerful data summarization feature that you can use to quickly summarize the organization or board data of the flags in a tabular or chart format.
Using this highly scalable analytics, you can extract voluminous data either from your board or organization and visualize them in a tabular or chart format to monitor the data trends. Moreover, you can refine the data based on a specific period and also design the analytics based on various attributes like Flag type, Flag by, Flag reason, and so on.
Key features of the Flag Data Analyzer:
- Visualize the data both at an individual board and organization level. So, the information at the organizational level can be aggregated from the various boards, whereas the same at the board level provides you with more specific information.
- Define the period of the analytics by specifying the start and end date.
- Select the type of table or chart from the variety of options, such as Table, Bar Chart, Line Chart, Bar Chart, Heatmap, Row Heatmap, and so on.
- Select the summation method such as Count, Sum, Average, Minimum, Maximum, 80% Upper Bound, Sum as Fraction of Total, and so on.
- Drag and drop attributes like Card Types, Priority, Release, and others to the Row or Column label and render the table or chart according to your requirements.
- Save your table or chart with a unique name and reuse it later to visualize a similar type of information.
- Access the analytics offline by exporting the tabular graph into Microsoft® Excel.
Flag Data Analyzer at the Organization Level
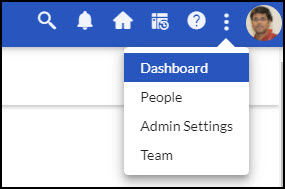
1. To access the Flag Data Analyzer at the organization level, click the More Options icon on the control panel, click Dashboard, and then click the Flag Data Analyzer link.
2. Select the Board Status for which you would like to generate the report. You can select any of the options: Active, Closed Boards, or both of them. Read this Help page to learn more about a Closed Board.
3. Select the Boards and the Card Types from the list. Both of them will be available based on the selection you made for the Board Status field. For example, if you have selected Active Boards only, then all the active Boards and their Card Types will be available in the drop-down.
4. To view the analytics for a specific period, enter the Start and End dates. All the cards that are flagged between the Start and End date will be considered in the Analytics.
5. Select the Custom Fields checkbox if you want to fetch the custom fields to the Pivot table to be added in a row or column and click Go.
![]()
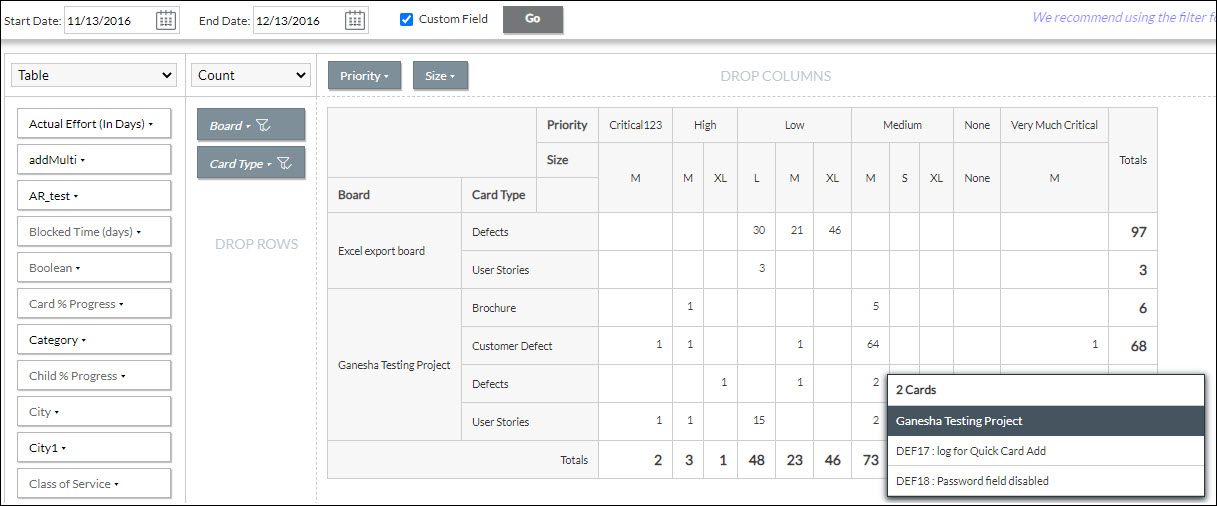
6. Select the table or chart format from the drop-down list.

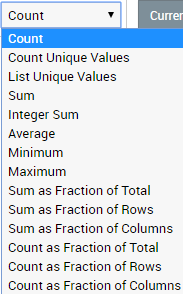
7. Select the summarization method such as count, average, or sum from the drop-down list.
8. To plot the table or chart, drag and drop the required attributes to the Row and Column level.
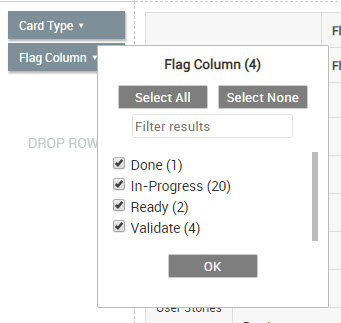
9. You can further refine the data by selecting the specific values of an attribute. To filter and select the required values, click the arrow icon in the attribute box, select the required options, and then click OK. Using the Planned Start Date and Planned End Date attributes in the Flag Data Analyzer (CDA) you can refine your card data more effectively and visualize data based on planned timelines.
10. To save your current table or chart, click the Filter Settings icon, enter a unique name in the Save as New field, and click Save As. You can access the same table or chart later by selecting that name from the Filter drop-down list.
11. Click the number to drill down any number to view the cards that contribute to it. The associated cards are displayed as a list. To get the details of any card, click the card ID or title from the list.
12. To modify an existing table or chart, select the same from the Filter drop-down list, make necessary changes, and then click Save. To delete the table or chart, click Delete.

13. To export the table into Microsoft® Excel, click the Export icon.
- Note 1: From the exported table, you can click any of the card IDs to indicate the card in the SwiftKanban application.
- Note 2: For quicker loading of the data, it is recommended to apply the filter.
- Note 3: The export option is available for the tabular graph only.
Flag Data Analyzer at the Board Level
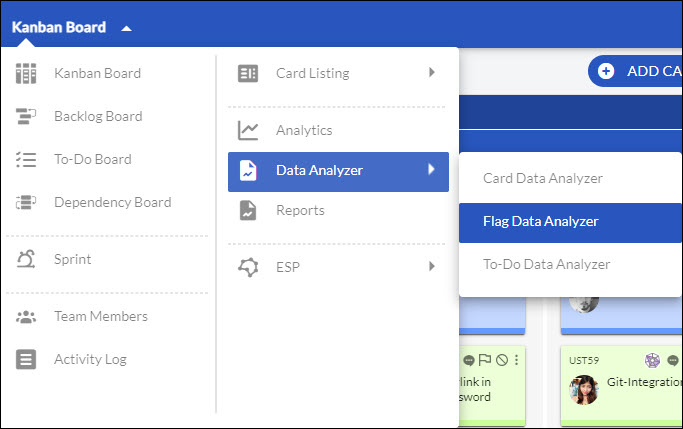
1. To access the Flag Data Analyzer at the Board level, go to the Main menu > Data Analyzer > Flag Data Analyzer.
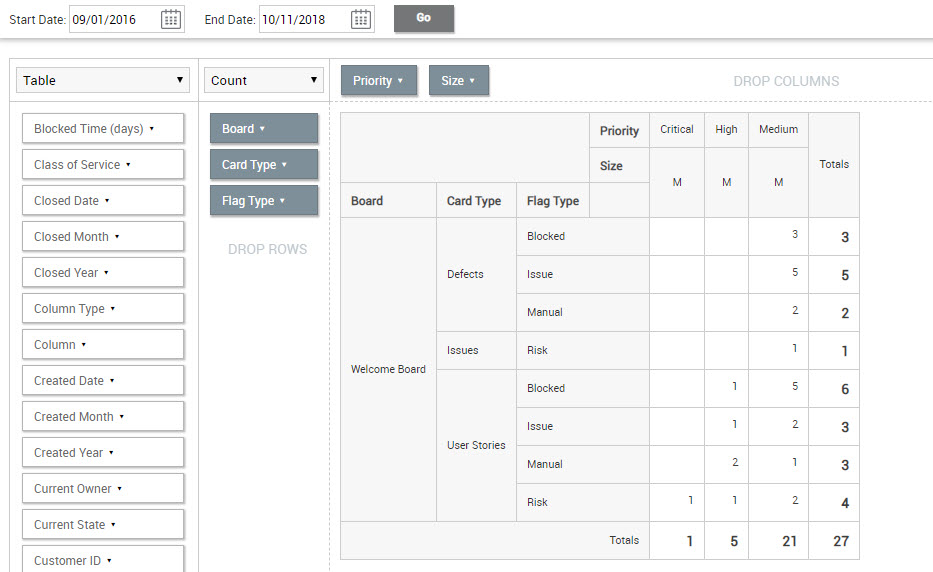
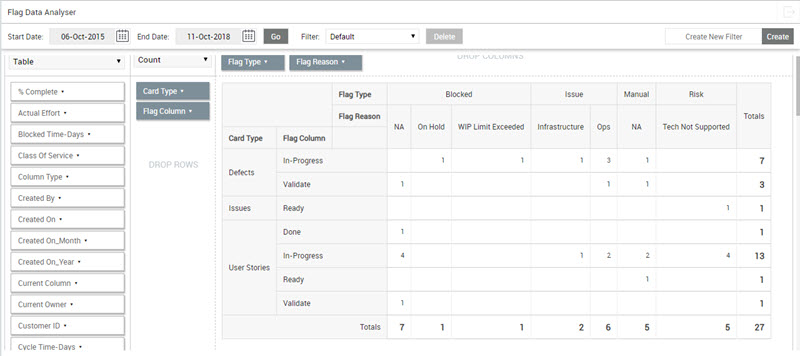
2. To view the analytics for a specific period, enter the Start and End date and click Go. All the cards that are flagged between the Start and End date will be considered.
![]()
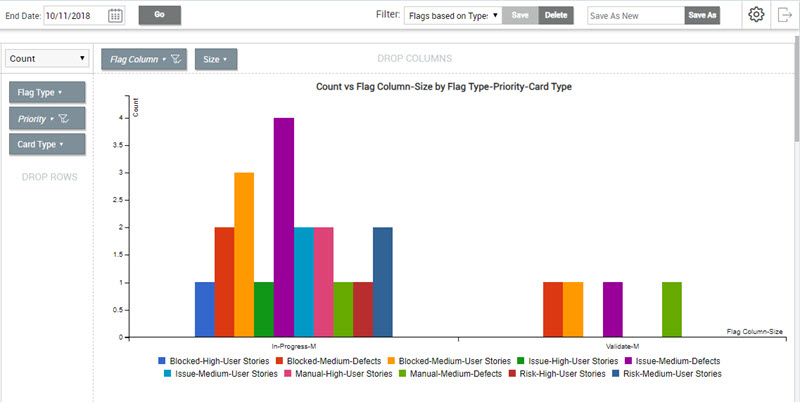
3. Select the table or chart format from the drop-down list.
4. Select the summarization method such as count, average, or sum from the drop-down list.
5. To plot the table or chart, drag and drop the required attributes to the Row and Column level.
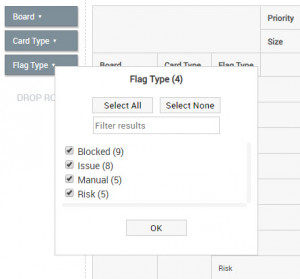
6. You can further refine the data by selecting the specific values of an attribute. To filter and select the required values, click the arrow icon in the attribute box that you have dropped into the row or column, select the required options, and then click OK.
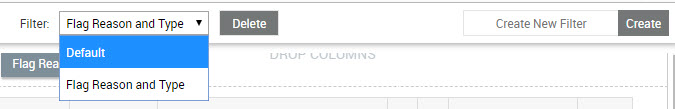
7. To save your current table or chart, enter a unique name in the Create New Filter field, and click Create. You can access the same table or chart later by selecting that name from the Filter drop-down list.
8. Click the number to drill down any number to view the cards that contribute to it. The associated cards are displayed as a list. To get the details of any card, click the card ID or title from the list.
9. To modify an existing table or chart, select the same from the Filter drop-down list and make the necessary changes. It will autosave the filter.
10. To delete the table or chart, select the filter, and click Delete.
11. To export the table into Microsoft™ Excel, click the Export ![]() icon.
icon.
Note 1: From the exported table, you can click any of the card IDs to indicate the card in the SwiftKanban application.
Note 2: The export option is available for the tabular graph only.
Set Global Filters at Board Level
A global filter can only be set by the user having a “Manager” role. As compared to a “Member” or “Reader” role, the “Manager” can view and enable an option, Mark as Global beside the Filter option at the top.
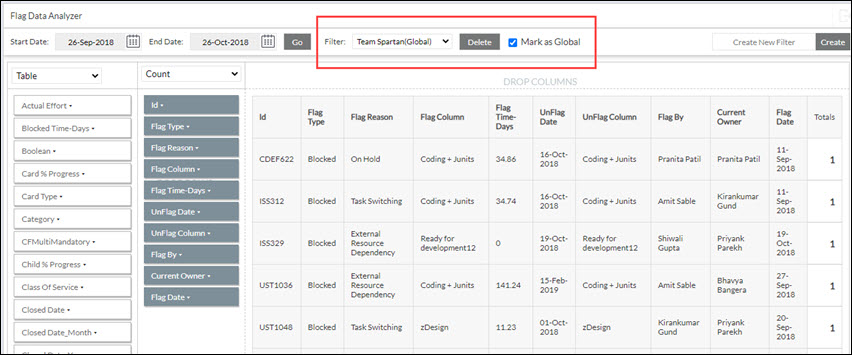
As a Manager, if you want to share a saved filter with other Members of the Board, you can select the Mark as Global checkbox. Enabling a filter as global modifies its name by adding a suffix after the unique name of the filter and also making it available for other Members to use in the Flag Data Analyzer. For example, if you save a filter name as Team Spartans and mark it as a global filter then the name will modify to “Team Spartans(Global)” as shown above.
This helps all the Members distinguish between a normally saved filter, which is user-specific against the filter set to global by the Manager and can be used by all other Members and Managers of the same Board.
Important Information
- The checkbox beside the option “Mark as Global” is available only for the Manager who has saved the filter as a global filter. All other Managers of the same Board don’t have access to disable the filter from global to normal filter.
- All Managers have access to delete the global filter. This specifically helps when the Manager who had set a filter as global is no more a part of the enterprise. In such a scenario, any other Manager of the same Board can delete the global filter created by a user who is now inactive.
- Other role users like Members can only view and use this Global filter for their data analytics.
- You cannot use the same name for two global filters on the same Board. Each global filter should have a unique name.