
In this article, we will help you understand the sprint planning feature.
|
Skip Ahead to: Define Sprint using Sprint Plugin |
Overview
As a Scrumban team, you may want to split a release into multiple sprints such that the scope of what needs to be delivered in a release can be effectively managed.
In this product, it is easy and quick to break down a release into several sprints with the intuitive drag-and-drop interface. You should have a release backlog defined so that cards from the release scope can be associated with different sprints you create. The sprint capacity and progress can be visually tracked as it progresses and also rolled up to the release progress, where again the visual indicators are based on these sprints.
You can directly push cards to the Kanban Board from the Sprint Scope itself.
Define Sprint using the Sprint Plugin
To define a sprint using the Sprint Plugin:
- Go to the Release page (Board > Release) and click the Sprints icon for the required release. On the Sprints page for the release, click Add New Sprint and enter the following details about the release:-
a. Sprint Name
b. Sprint Start Date and End Date
c. Sprint Capacity (In points or as per the UOM defined)
Note 1: The Sprint name is mandatory.
Note 2: No Sprint can be created and tracked for a Closed Board.
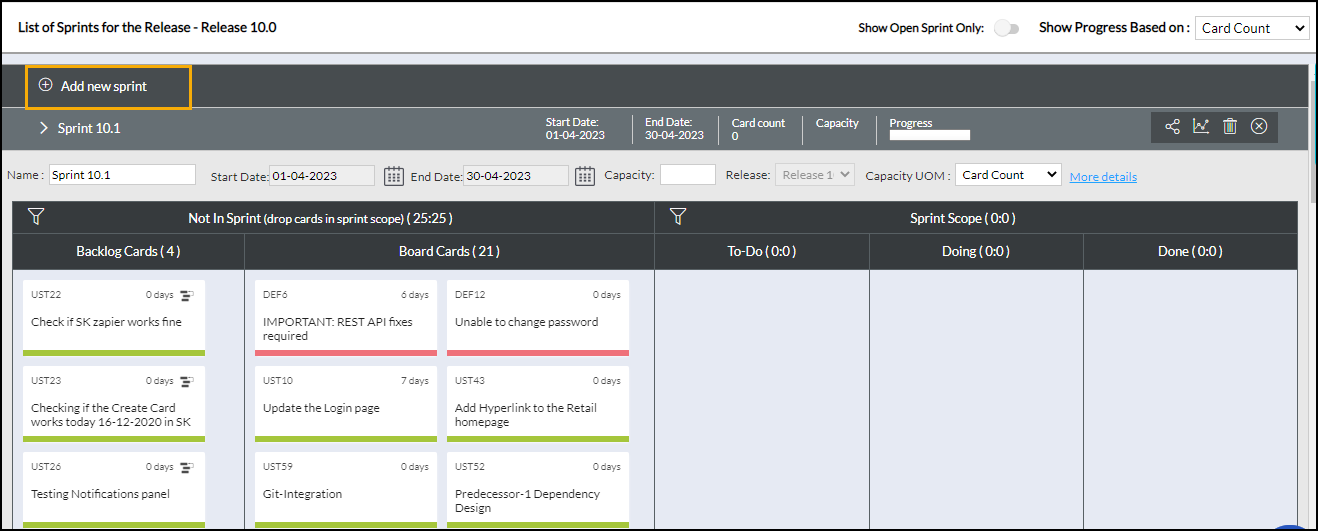
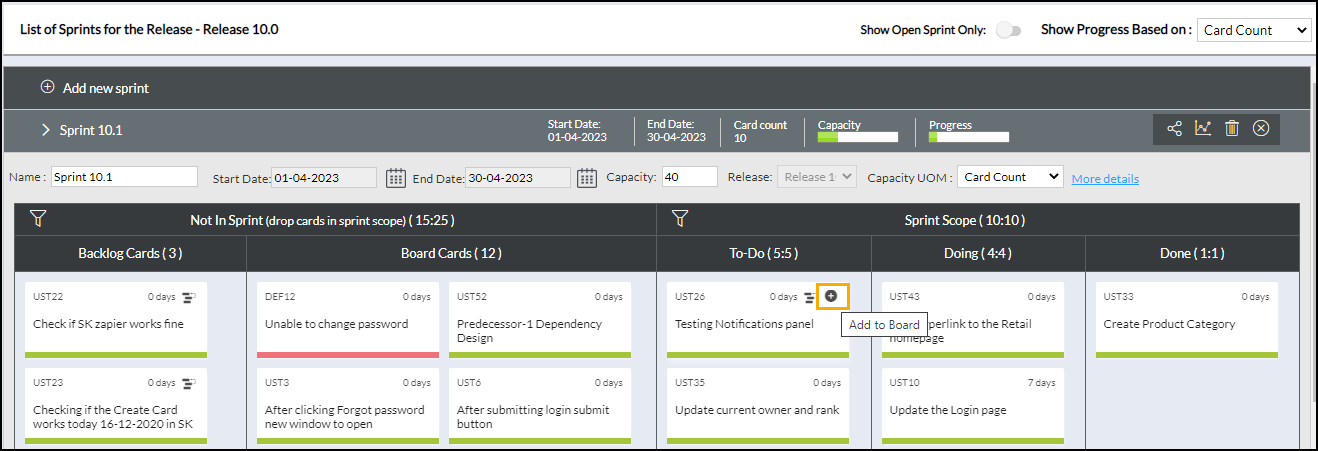
The Sprint screen is divided into two columns: Release Cards and Sprint Scope.
Release Cards are further divided into two columns: Backlog Cards and Board Cards.
- Backlog Cards: Contain those backlog cards that are in the Release Scope.
- Board Cards: Contains those board cards that are in the Release Scope.
2. To define the Sprint Scope:
- Drag cards from the Release Cards to the Sprint scope. The cards you drop into the sprint bucket will be associated with the sprint.
- Before you pick up the cards in the backlog (indicated by a green Status line), you can run through the Card Title and the estimate, or click the card title link to view its details. On clicking back in the Detail view, you return to the Sprints page.
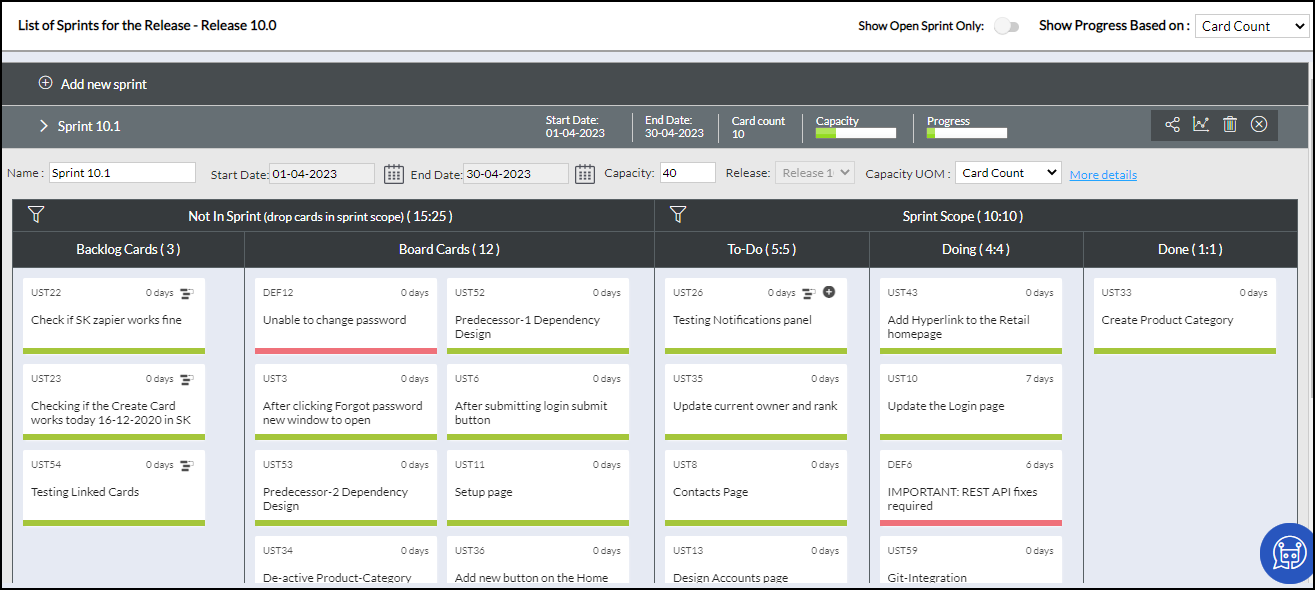
- Locate the card by scrolling through the pages by clicking the page numbers below or clicking the first, previous, next, and last links. To limit the cards in the view, set the card count in the right corner, for example, 25 shows 25 cards on a page.
- To filter the columns to view specific cards, click the Filter icon on the top right. Type the search string in the empty filter text boxes or select value(s) in the Filter drop-down lists.
- To remove a card added to the Sprint scope, drag and drop the card back into the Release Cards column. Doing this will disassociate the card from the sprint but still keep the card active in the release.
3. Click the Close icon after you are done.
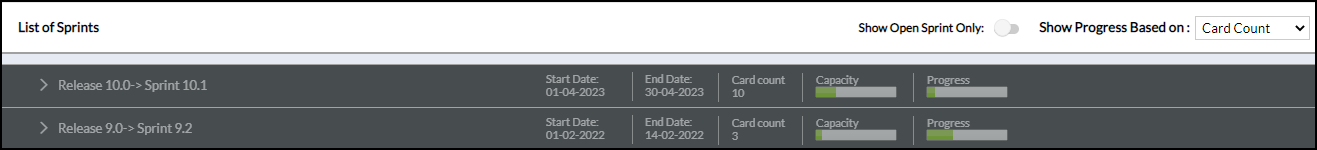
The Sprints page lists open Sprints if the slider button is ON; else it lists all Sprints that you defined, along with the details i.e,. sprint dates, card count, progress, and capacity estimated.
To view the cards scoped in the past sprints, click the sprints row, and to hide the details, click it again. Thus, you can access the past sprint details to plan a new sprint better.
- The Card Count displayed for the newly added sprint indicates the number of cards scoped in the sprint.
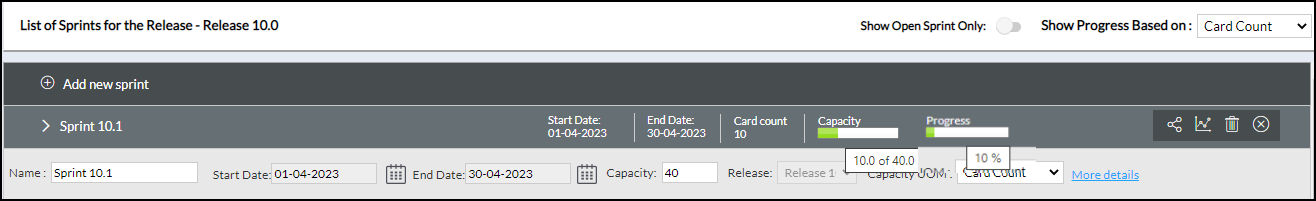
- The Progress bar for the sprint indicates the sprint progress, which shows a percentage of cards archived over the total cards scoped, based on card count. For example, the progress bar in the image above shows 50% as two cards out of four cards are archived.
- The Sprint capacity indicator denotes to what extent the sprint is booked or under-booked (white band in the capacity bar). The bar completely in red indicates that the release is overbooked. On hovering over the Capacity bar, you can view the capacity booking in the percentage that is the sum of estimates of cards scoped in the sprint over the sprint capacity entered. For example, in the image above, the Capacity shows 10 points, which is the sum of estimates of all cards scoped for the sprint, against the capacity entered as 40 points.
- To rescope the sprint, double-click the required sprint and drag and drop cards from the Release cards column to the sprint scope column or vice versa.
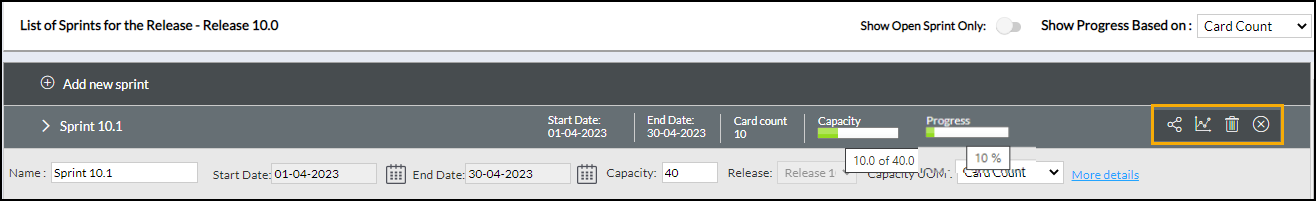
- To share a sprint across other boards, click the Sprint icon.
- To delete a sprint from the enterprise permanently, click the Delete icon for the required sprint.
- You can easily track the overall progress of the cards tagged to the different releases by selecting Card Count, Estimate(days), or To-Do(Hours)as the values for the releases, with Show Progress Based on preference. Thus, you can easily monitor the progress of releases across multiple projects.
Executing Cards from the Sprint Scope
After you have defined the scope for the sprint, you can push the cards directly from the Sprint Scope.
When you are viewing or editing a sprint, you can click the Add to Board icon on the card added to the Sprint Scope. The Add to Board icon will be available to cards currently in the backlog only.
On clicking, it shows up lanes and its column. Click the required lane and its respective column to which you want to move the card.
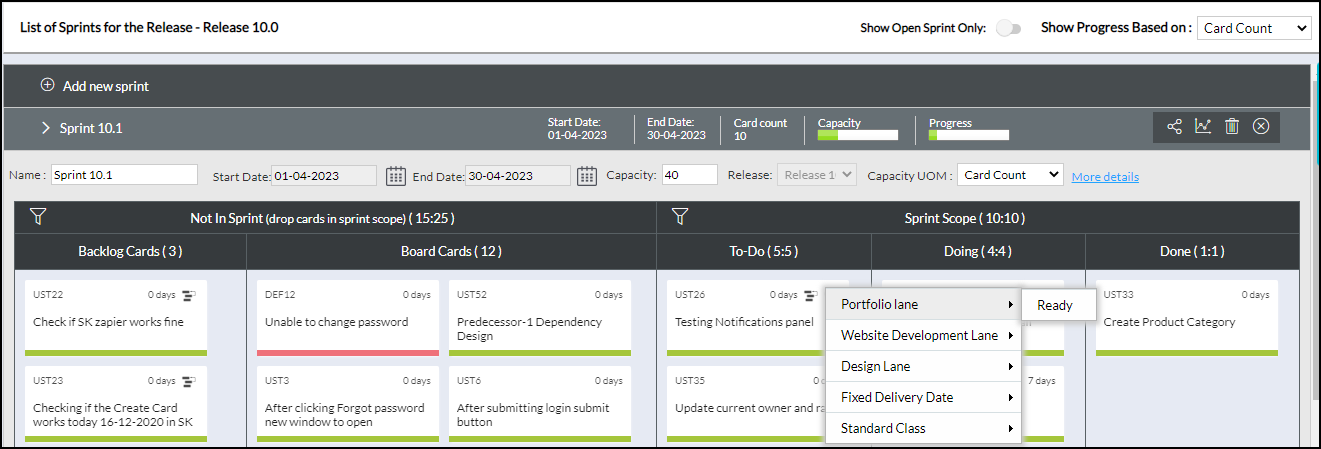
After adding the card, it will no longer show the Add to Board icon for that card, indicating that the card is already added to the board.
Closing a Sprint
If you don’t want a sprint for a release, you can close, i.e., inactivate the sprint. To close a sprint, click the Close icon on the extreme right of the toolbar for the specific sprint. If you want to activate a closed sprint again, click the Open icon for it.
Sprint Burndown Chart
For SCRUM practitioners, the product provides the Sprint Burndown chart apart from the Release Burndown Chart. They help teams to track their progress against the Sprint plan in their daily scrum meetings. Burndown charts can be tracked for any project containing tasks with time estimates.
To view the burndown charts for a sprint:
1. Select Sprints from the Selected Board breadcrumb menu.
2. Click the Charts icon for the required sprint. The Burndown chart is displayed below showing how the remaining effort comes to ‘0’, which also is a burn-up chart if you track the progress of Actual Effort.
3. Click the Close (X) icon to close the chart.
Note: To-Do owners should enter the To-Do Estimates, Actual Effort, and Remaining Effort daily to track the progress of the sprint in the Burndown chart. You can enable the Time-Tracking Plugin to enter efforts on To-Dos. Effectively, you can see some meaningful data generated on the Burndown Charts. See Logging Effort for To-Dos for details on how team members can log effort for To-Dos.

- Interpret the Actual, Planned, and Remaining values in hours only, as team members will be entering daily effort in hours.
- The Sprint Burndown chart plots the Daily Remaining Effort (that the to-do owners enter for cards scoped in the sprint) on the Y-axis against the dates on the X-axis (from the sprint start date through the sprint end date). The burndown slope is the red line indicating the remaining hours as the sprint moves through the end date.
- The Sprint Burnup line (in blue) is plotted for the sum of all Daily Actual Effort (that theTo-Do owners enter for the cards scoped in the release) on the Y-axis against the dates on the X-axis (from the sprint start date through the sprint end date).
- The chart also shows a green line indicating the planned sprint slope i.e. how the cards should have been completed through the sprint ideally. It is the sum of the remaining effort for To-Dos of cards on the sprint start date through the sprint end date closing at ‘0’.
You can filter the Burndown chart to view it for specific card types. Click the Filter icon on the chart toolbar. The filter will apply even for export in MS Excel format.
Exporting Sprint Burndown
The Sprint Burndown can be exported in MS Excel format, along with the Burndown data. Click the Export icon on the chart toolbar at the top-right. If you have filtered the chart for specific card types, the chart and the data will be exported for cards of the filtered card types. You can open the file in MS Excel or your preferred spreadsheet application.
