
In this article, we will help you understand the View Reports.
|
Skip Ahead to: |
Overview
Get some quick status on work in a consolidated view along with significant metrics through the product operational reports – Status reports and Timesheet reports.
Status Report: All the cards that had any movements on the board (either added to the backlog or moved to any other lane) between the lanes are displayed in this report. The Status reports display the status of cards in two different views, namely:-
Note: If the “Select the days that you want to consider as holiday(s)” Board policy is enabled, the days marked as holidays will be excluded from Status Reports for team-member-wise, Card-wise, Net Work Time, and Lane-wise Cycle Time Analysis. These days will not be considered in Work Time, Wait Time, and Blocked Time, ensuring that only working days contribute to these calculations.
- Team-Member-wise: –This status report gives a quick snapshot of the following:
- Which cards did various team members work on during the week( or selected date range)? And how much time was spent, working/ waiting?
- What are they working on currently?
- What is in their backlog to work on next?
- Card-wise: – Card-wise status summary helps in analyzing the progress for various cards, through various value-stream stages and to identify the work/ wait times in those stages and plan improvements to reduce the time. The detailed status helps you to analyze the card progress as it moved through each lane.
Timesheet Report: Track the actual effort logged by team members or the remaining effort required to complete the ‘in-progress’ tasks. You can even track the break-up of Estimated Actual and remaining effort for every To-Do created for a card. To know more, click here.
Net Work Time: Get a report of network time for each card worked upon while the card was in-progress and not blocked or unassigned. This way the actual work on a card can be compared to the initial estimation.
Lane-wise Cycle Time Analysis: This report helps you identify the problem area in your project by providing analytical insight into Average Work Time, Average Wait Time, and so on of your cards for each column of the project.
Hierarchy Status Report: You can use the board-based Hierarchy Status report to get detailed information about a linked card about its parent, or child cards. The report renders all the cards on that board that have been linked to a parent or child with any other cards of the same board or across any other boards. This status report shows various information on the linked cards like Card Title, Board they belong to, Lane, Column, and other details in a tabular format. For further information related to this report, click here.
Note:
- To help you interpret the reports better, the report header displays the selected filter options.
- If Lanes are enabled in the Kanban board process, the ‘Lane’ column will be displayed in the ‘Status by Team Member’ and ‘Status by Card’ reports to identify the applicable Lane for the card.
Navigation
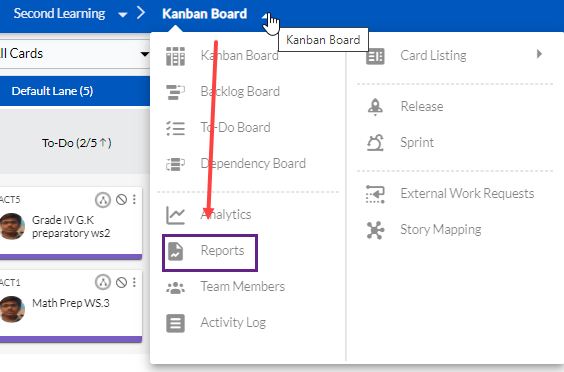
To navigate to the Reports, click the Kanban Board menu and select the Reports option.
Status by Team Member
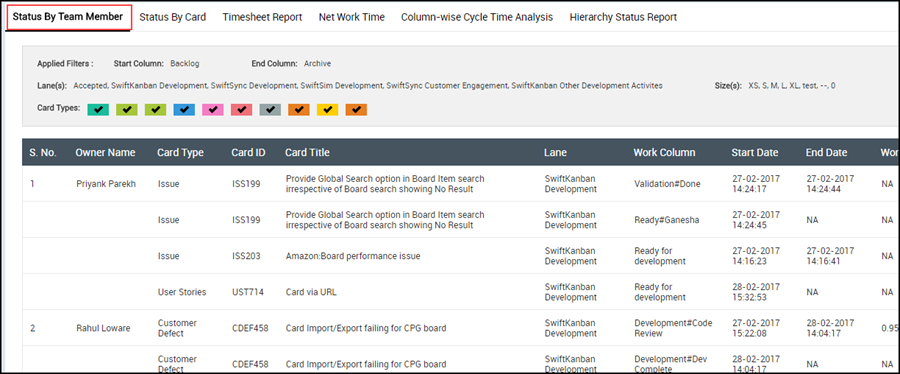
To view reports based on Team Members, click the Status by Team Member tab.
Status by Card
To view the report based on cards, click the Status by Card tab.
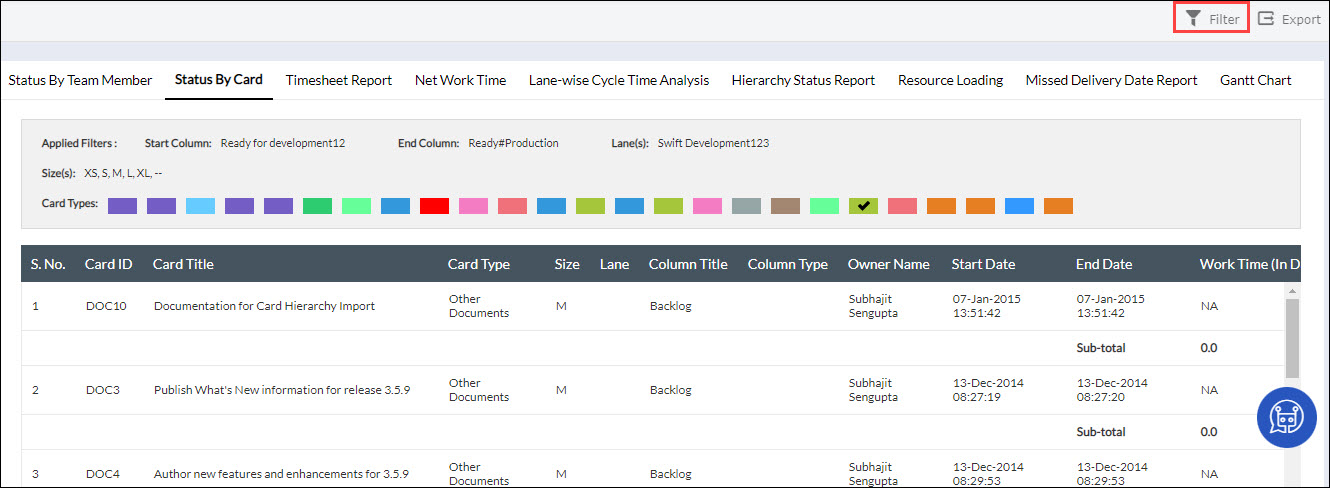
- The report is displayed for all cards and all team members by default.
- To filter the reports further, click the Filter icon on the Side toolbar on the top main bar and select from the filter options.
- In the Filter By option, select Date to view card movements for cards on the board during a specific date range. Alternately, select the Status option to view details for cards with a specific status. Select the following options, applicable for Date and Status options:
- Start/End Date:– The start and end dates to generate the report. This applies to the Date option.
Note: When you select the Date option, those cards that fall between the Start and End date and the Start and End column set by you are shown in this report. Moreover, the End Date in the report is shown as N/A for those cards that are archived anywhere between the Start and End columns.
- Card Status: If you have selected the Status option, select All, In-Progress, or Blocked, as required. The status ‘In-Progress’ indicates the cards active on the board. Also, select the View. Select Detailed if you want to view the movements of the card across lanes, along with the metrics for each card movement. Select Summary to view the details and analytics of the card while it is in the current lane.
- Card Type – You can filter the report based on various card types available/defined. E.g. User Stories, Issues, Defects or any custom card types configured for the project.
- Display Metrics In (Days/Hours/Minutes): The metrics can be rolled up based on what you select as the Time unit i.e., Weeks, Days, or Hours. You can use the rolled-up metrics for better comparison and analysis. This will also make it easier to work on and share the exported numerical data of the Status report in the rolled-up time unit you prefer. By default, the metrics are displayed in exact time, i.e., in the format days, hours, and minutes.
- Priority – Filter based on various priority values, e.g., Critical, High, Medium, etc.
- Lane: Select one or all lanes, if you have defined more than one. If you select the ‘All’ option, the chart considers all cards that exited the last lane.
- Start Lane and End Lane: Choose exactly the stages for which you want to generate the report by selecting the Start Lane and End Lane. The charts consider the cards that have exited the End Lane in the date range and may or may not have entered the Start Lane.
- Class of Service: – Filter based on various classes of service, e.g., Expedite, Fixed Delivery Date, etc.
- Size – Filter based on card size value, i.e., XL, L, M, etc.
- Team Member – To view the status of cards for specific team members in the project, select the By Team Member option. To select multiple team members, hold down the CTRL or SHIFT keys in combination with the cursor/arrow keys.
- To view the status of cards for team members belonging to a Team, select the By Team option. The Team is defined at the enterprise level, where users are selected to be part of a team. The ‘By Team’ list displays these members, provided any of the members of the team are assigned to your project. For example, if there are 15 teams at the enterprise level and members from only 4-5 teams have been invited to this project, only those teams will be displayed in the list.
Click Close. The report will be displayed based on the filter options selected.

Timesheet Report
Timesheet Report helps you to track the actual effort logged by team members or the remaining effort required to complete the ‘in-progress’ tasks. You can even track the break-up of Estimated Actual and remaining effort for every To-Do created for a card. The report also provides various filter options that’ll help you to track effort for specific card types, team members/team, and periods.
This report is available if you have enabled the Time-Tracking plug-in (Admin Settings>>Plugins>>TimeTracking (beta). Contact the SwiftKanban support team to request the plugin.
This tab has the option to modify the layout as per your requirements.

This timesheet report layout is a powerful timesheet data summarization feature that you can use to quickly summarize the timesheet report, especially for a longer date range in a tabular or chart format.
Using this highly scalable analytics, you can extract voluminous timesheet-related data either from your board or organization and visualize them in a tabular or chart format to monitor the data trends.
Key Features
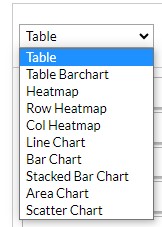
- Select the type of table or chart from the variety of options, such as Table, Bar Chart, Line Chart, Bar Chart, Heatmap, Row Heatmap, and so on.
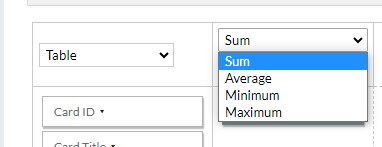
- Select the method of summation, such as Sum, Average, Minimum, and Maximum.
- Drag and drop attributes like Card Title, Task Name, Team Member, Card ID, and others to the Row or Column label and render the table or chart according to your requirements.
Note: Exporting data will work based on the filter applied on the side toolbar of the report and not based on the pivot table structure.
Follow the steps to generate the Timesheet report:
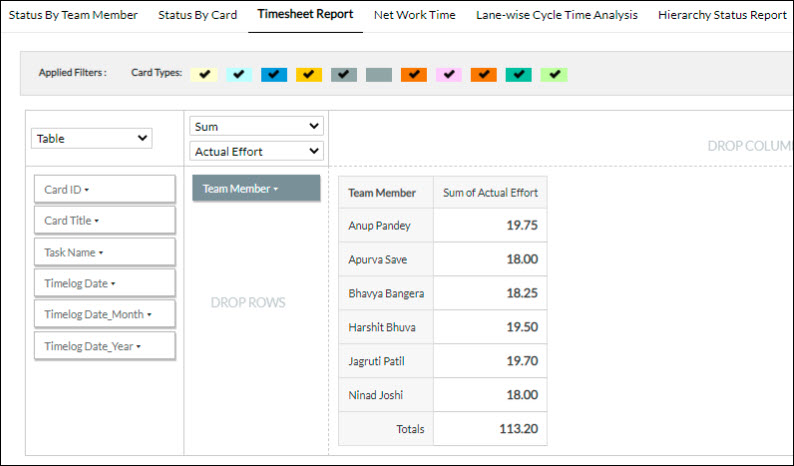
1. By default, Table format, team members, Sum, and Actual Effort are selected.
2. Apply the filter option by setting the date range, card types, and team members for which you want to generate the Timesheet report.
3. Click Close. The report will be displayed based on the filter options selected.
4. Select the table or chart format from the drop-down list.
5. Select the summarization method, such as average, sum, and others, from the drop-down list.
6. To plot the table or chart, drag and drop the required attributes to the Row and Column levels.
7. You can further refine the data by selecting the specific values of an attribute. To filter and select the required values, click the arrow icon in the attribute box, select the required options, and then click OK. For example, for every To-Do, we have selected the To-Do Description attribute and the sum of efforts logged by the team members.

Filter Timesheet Report by ‘Lane’ Attribute
You even have the option to apply a filter on the ‘Lane’ attribute of your cards and generate the Timesheet Report to understand the effort spent on specific cards lane-wise. To plot the table or chart giving a report specific to Lane, drag and drop the ‘Lane’ attribute to the Row and Column level.
NOTE:
- If the card status is active on your Kanban Board, the particular lane of the Kanban Board will be shown in the report.
- If a member is filling the timesheet of a card that is present in your Backlog, the report will display the lane column as ‘Backlog’.
- If the card status is archived/aborted/deleted, you will still be able to generate the Timesheet report of the card showing the lane details of the card in which the card was last present.
- If the lane itself gets deleted, the report will still show the name of the lane for that card as the card was present in the lane before the lane was deleted.

Net Work Time
Net Work Time Report helps you to track the actual time spent working on a card, excluding its blocked time and the time it was unassigned in lanes of the In-progress type. The report provides various filter options that’ll help you to track work time for cards during a particular date range or based on the status of cards, irrespective of owner or team.
Note: The Status By Card and Net Work Time reports may look similar, but there is a difference in the calculation. The Net Work Time does not include the time the cards were unassigned in the ‘In-Progress’ lanes.

Exporting Reports
The reports can be viewed and saved in MS Excel format. If you have filtered the list for specific team members or cards, the report will be saved/viewed for filtered cards/team members. Click the Export icon on the top right of the toolbar. In the exported file, you can also view the To-Do description added for every To-Do. You can save the file in MS Excel or your preferred spreadsheet application and even use it for generating pivot tables.