
In this article, we will help you understand CFD forecasts in ESP analytics.
|
Skip Ahead to: |
Capacity Distribution
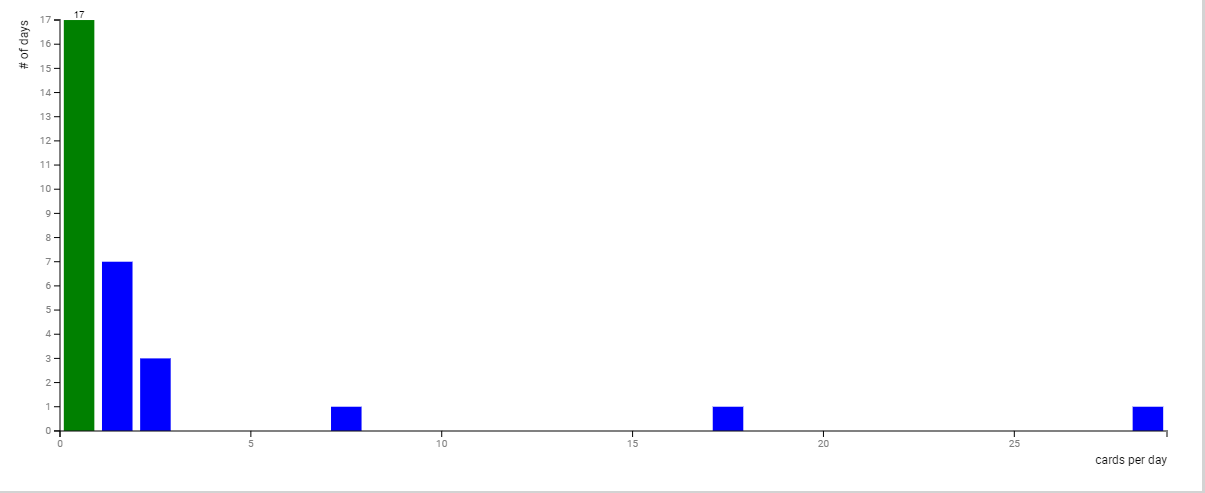
Based on the throughput in the system for 28 days, i.e. the cards being archived or moved to the Done lane during that period, this distribution chart shows the number of days when a particular count of cards has been completed on a daily basis. The Y-axis shows the range of days and the X-axis shows the range of cards being archived.
For example, in the below image, it is clear that most of the time 1-5 cards per day got completed, although there are some outliers like one instance where more than 25 cards got finished in one day.
Forecast Distribution
The Forecast distribution is based on the Monte-Carlo simulation. The histogram shows the number of runs that result in a given number of cards shown on the x-axis. The histogram is normalized and integrated from right to left to generate the cumulative probability distribution P(x ≥ n) shown in black plotted against the y-axis. The tooltip shows the x and y-intercepts relating to the number of cards completed and the cumulative probability.
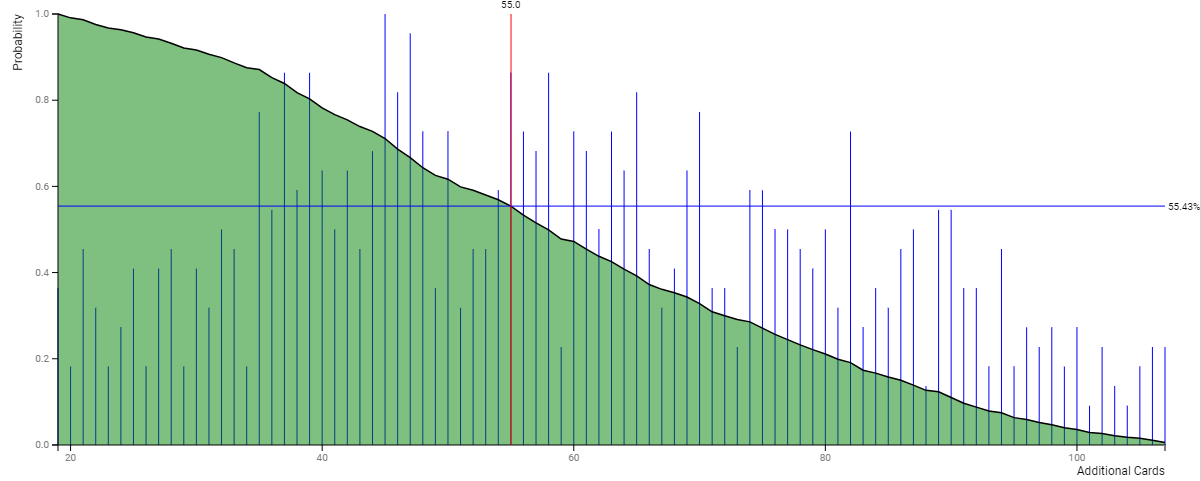
In the above image, the system predicts that with the current throughput rate, there is a 55% probability that the team can complete an additional 55 cards.
Calculation Logic for Forecast Distribution
Forecast is generated using Monte-Carlo simulation based on daily throughput (capacity). The set of daily throughput recorded in the reference period forms the basis of the simulation. We make the assumption that each observation in this set is independent and identically distributed (IID), and the overall process is stable. In other words, we do not take into account the temporal/sequential nature of the observation and account for the temporal pattern in the data.
For each day of one simulation run, we draw a random sample with replacement from the throughput set and add this value to the sum of previous samples drawn. The process is repeated for each day of the forecast duration.
We run the simulation for thousands of times and histogram the number of cards completed in each run. This histogram is normalized by the number of runs and used to generate the cumulative distribution of probability (CDF).
The actual implementation further takes into account the natural weekly cadence in work and uses a trimmed mean to remove extreme values to reduce the impact of IID assumption.
Forecast
This chart shows the forecast of cards completed for the duration of the forecast. The different regions starting from dark to light indicate the number of simulation runs that achieve a given number of card completions. Moreover, you can define the start date and duration of the CFD forecast by entering the value in the field.
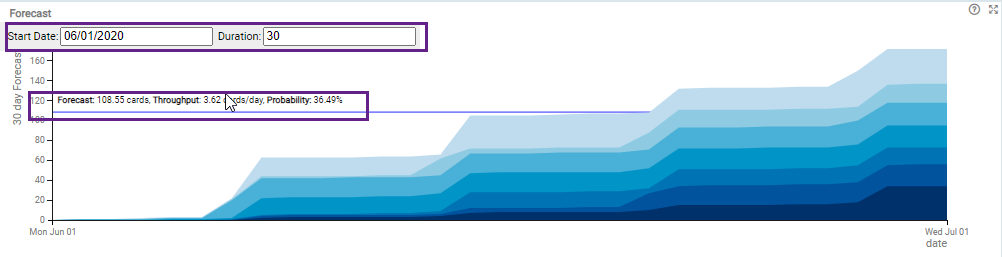
At each point in the simulation, all possible outcomes are divided using an extended 16-quantile [Quantile] scale [min, 1/16, 1/8, 1/4, 1/2, 3/4, 7/8, 15/16, max]. The relationship of these values to the probability is shown below:
| Quantile | Cumulative Probability |
|---|---|
| max | 0.00 |
| 15/16 | 6.25 |
| 7/8 | 12.50 |
| 3/4 | 25.00 |
| 1/2 | 50.00 |
| 1/4 | 75.00 |
| 1/8 | 87.50 |
| 1/16 | 93.75 |
| min | 100.00 |