In this article, we will help you understand aging in ESP analytics.
|
Skip Ahead to: |
Aging Analytics is the combination of a couple of composite charts that work as a leading indicator for the non-finished cards and provide insight into which items are flowing well and which are stuck even if not formally blocked.
Applying Filters
You can apply filters based on card attributes and the value stream stages to refine your data for the analytics. Moreover, the time range for the analytics can also be adjusted using the Temporal Range Filter. Read more about them here.
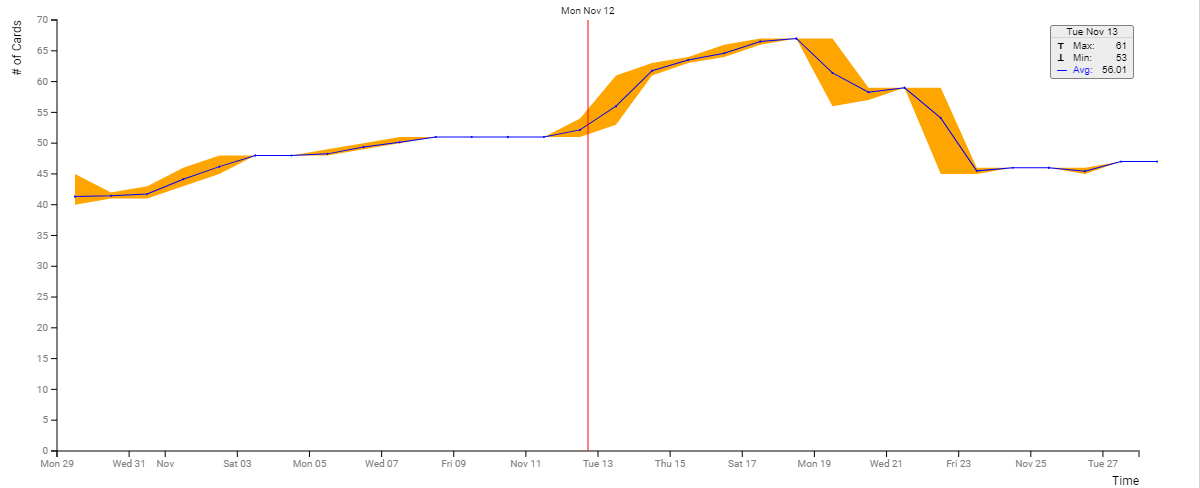
WIP
Time plot of minimum, maximum, and average WIP per time period defined by Time unit for the selected region of the value stream. The blue line shows the average WIP and the orange area shows the envelope formed by the corresponding maximum and minimum WIP in each time period. The average WIP is calculated as the time-weighted average, which means the total time spent by all the cards in the selected region of the value stream (column) normalized by the time unit.
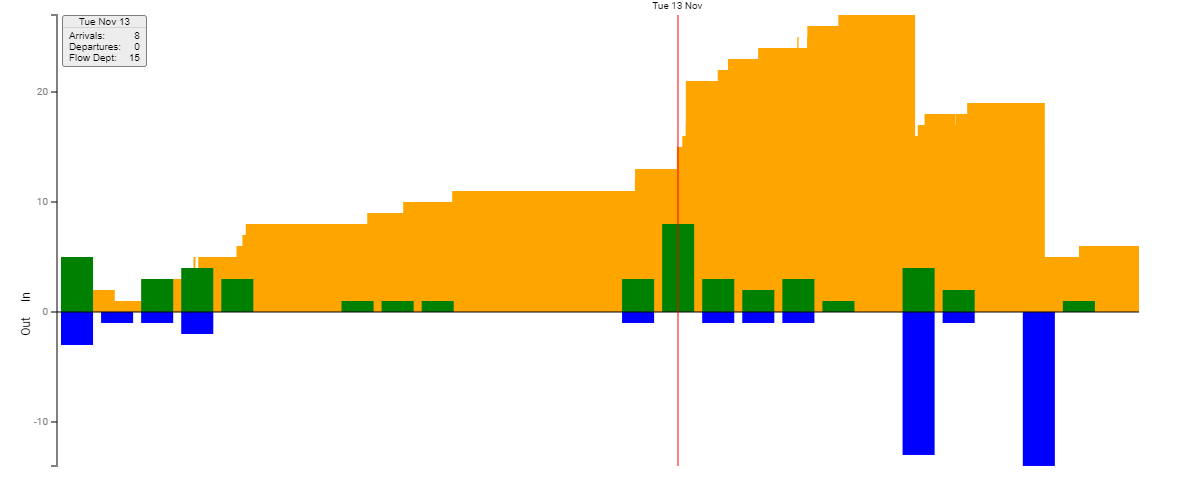
Flow Debt
Flow deficit combines multiple charts together to provide a comprehensive visualization of flow. The in-flow is shown above the x-axis using green bars, the out-flow is shown below the x-axis using blue bars, and the cumulative difference between the in-flow and the out-flow is shown in the shaded orange area behind the bar charts. The cumulative difference at the beginning of the time interval is initialized to 0, thus allowing us to visualize the change in WIP during the selected interval.