In this article, we will help you understand liquidity in ESP analytics.
|
Skip Ahead to: |
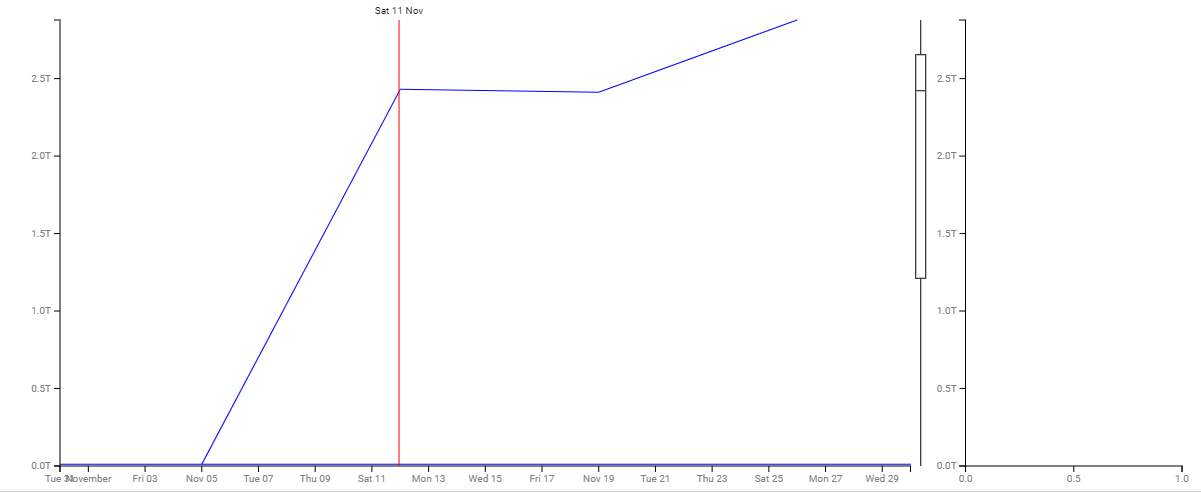
Transactional Volume
The Transactional Volume displays the number of decisions made on the Board. Here, the decision means when a card moves from a wait column to a work column, or wait column to another wait column. So, each such move is considered a decision and the chart shows how many such decisions are made on a daily, weekly, or monthly basis during a time range as specified in the Temporal Range filter.
![]()
Raw Volatility
Raw volatility is the derivative of the Transactional Volume, which compares the transactional volume (number of decisions made) of yesterday and today. The Y-axis shows the range of transactional volume and the X-axis shows the duration as specified by the Temporal Range filter.
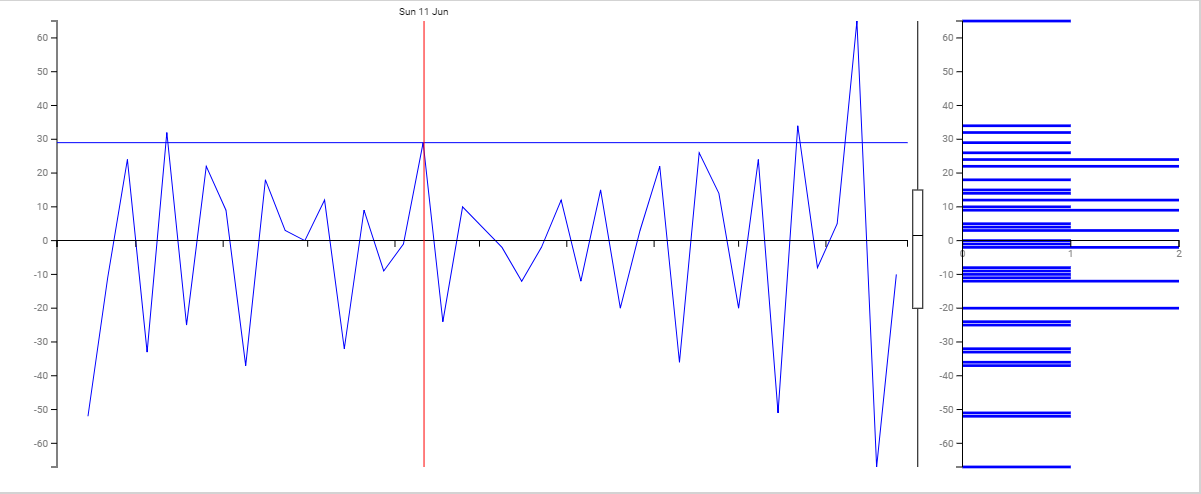
Volatility
Volatility can be termed as the difference of difference or the volatility of Raw Volatility. The line chart compares the raw volatility of yesterday and today and renders its graph. The Y-axis shows the range of such difference and the X-axis shows the duration as specified by the Temporal Range filter.
The side bard is the histogram of volatility where each bar is the count of the number of times the volatility had the value on the volatility vertical axis.
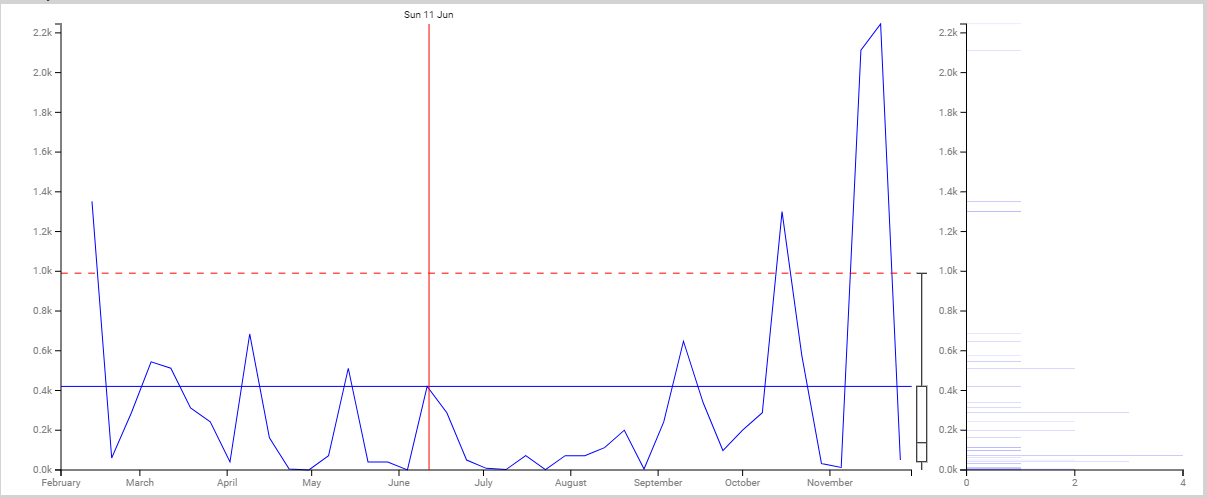
Turbulence
The Turbulence can be interpreted as the volatility of the volatility. This chart tracks the difference between the volatility of yesterday and today and plots the line where the Y-axis shows the range of such difference and the X-axis shows the duration as specified by the Temporal Range filter.