In this article, we will help you understand the Blocking Analysis.
|
Skip Ahead to: |
Overview
The Blocking Analysis view helps you to analyze the most common reasons for blocking the cards by teams. You can do a Pareto analysis by looking at causes of bottlenecks because it helps stimulate thinking, organize thoughts, and continuous improvement. You can take corrective measures to address these reasons based on priority in the retrospectives.
Currently, we have two versions of analytics: New and Old. In both these versions, you can view the Blocking analysis.
Filter:
To refine the data of the blocking analysis, click the Filter icon on the side toolbar. You can filter the analytics based on the following parameters:
- Start Date and End Date from the calendar to limit the scope of data.
- Display Time In: The unit of time to be used for calculation and displayed in the analytics.
Note: If you select the time unit as Weekly, then please remember that the week is considered from Sunday to Saturday.
- Lane: Select one or all Lanes if you have defined more than one. If you select the ‘All’ option, the chart considers all cards that have been blocked in each lane.
- Start and End Column: Choose exactly the stages for which you want to generate by selecting the Start column and End column.
- Card Type, Size, Class of Service, and Priority: Use these filters to further refine your data. Select the required values of these card attributes by clicking the rectangular boxes.
On applying the above filters, the chart shows the total Blocked Time of cards that were blocked/unblocked in any columns within the Start and End column. It includes cards that have been blocked/unblocked within the Filter date range and includes cards blocked before the Start date or remain blocked until the End Date.
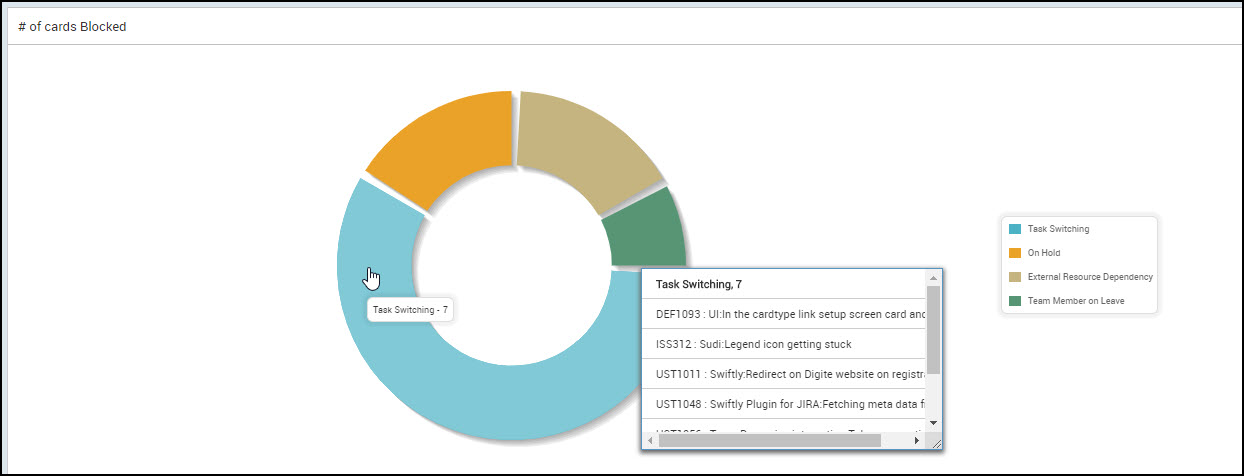
# of Cards Blocked
The number of Cards Blocked chart gives you a visual of the relative distribution of cards across different Blocking reasons. Hover over a pie to view the blocking reasons and the number of blocked cards about each of these reasons.
Click the pie to drill down to view the card-level details.
Note: This pie chart analytics is available in both the Old and New versions of Analytics.
Time Lost to Blocking
The Time Lost to Blocking histogram, which enables a Pareto analysis of Blocking Reasons and the time loss each Root Cause is contributing to. It plots the total Blocked Time of cards (measured on Weeks, Days, or Months) on the X-axis for a particular blocking reason.
Hover on the bar to view the blocking reason and the total time lost.
Click the bar to drill down to further details like the Blocking Reason and the number of cards pertaining to that reason. You can further select an individual card to view the card-level details.
Note:
- This pie chart analytics is available in both the Old and New versions of Analytics.
- If the “Select the days that you want to consider as holiday(s)” board policy is enabled, the selected holiday days will be excluded from the calculation of Cycle Time, Lead Time, and other related time metrics. This ensures that any days marked as holidays do not affect the performance analysis or time calculations for the cards during those periods.

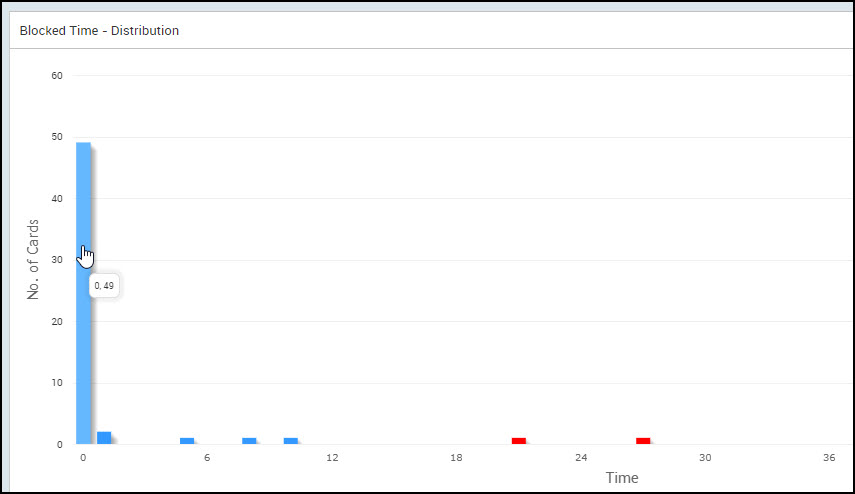
Blocked Time-Distribution
The Blocked Time Distribution chart provides a comparative analysis between the number of blocked cards and the average time lost on those blocked cards. The Y-axis shows the range of the number of cards and the X-axis shows the time range. The outliers are colored in red.
So, you get to know whether most of your blockers have generally consumed more or less time to be resolved, or the outliers are too many in numbers.
To check the Blocked Time-Distribution go to the filter option of the Cycle Time – Distribution analytics widget, click the Filter icon and change the metric to Blocked time from the drop-down.
Tips: If you can’t see the Blocked Time-Distribution analytics, then look for either Cycle Time- Distribution, Work Time -Distribution, or Wait Time -Distribution widget, click the Filter icon on the widget and select Blocked Time from the drop-down for the Metric field.