The unique Board Playback feature allows users to playback the board for a past time period and observe patterns of flow. It animates a playback of the changes like a deck of cards flying through cards getting created, cards being assigned to people, being pulled, and getting archived.
Selecting a date range and the Lane shows you a complete replay of events that took place during the period for the cards on the board (i.e., excluding the Backlog and the Archive Lanes). You can also track the CFD and Resource Graph in sync with the card movement animation.
Note: If you have modified or added a Lane during the period for which you want to run the Board Playback, then the Playback feature will not work as desired, and the replay will stop on the day you have modified or added that Lane.
View the replay of events to identify flow problems in your process.
- Click the Playback
 icon on the left menu bar.
 - Select the Lane and the period for which you want to view the playback. The Playback opens in a new browser window.
- Click the CFD icon and the Resource Graph icon at the bottom right of the screen to view the graphs. You can hold onto the chart and drop it into a space on the board so that it does not obstruct the view of the card movement.
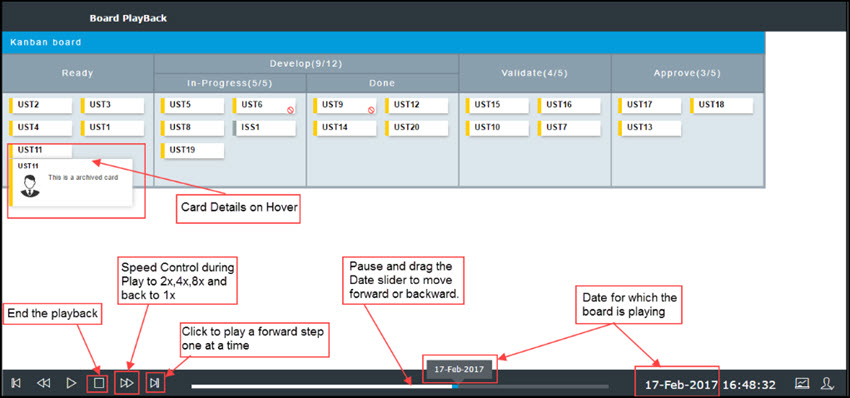
- Click the Play button on the toolbar at the bottom, which is a toggle button to pause and play again.
- To view one card movement at a time, you can click the Next button. Click the Previous button to play a reverse step to track from which column the card was moved ahead
- Click the Speed Toggle Buttons to control the speed of the playback to increase it to 2x, 4x, 8x, and reduce it back up to 1x.
- The date slider shows progress and can also be dragged to push the playback forward or backward.
- The date in the top-right corner helps to track the board playback date.
The CFD plots the chart with different colors indicating various columns on the board, and the total cards on a particular date. For help on the CFD interpretation, see the Analytics help page. The Resource Graph shows the volume of cards on a resource’s plate as of that date. So you can interpret if the resources are evenly getting assigned evenly to cards as tasks are getting completed.
Do give it a spin and post your feedback and suggestions at [email protected].