
The “Lane-wise Cycle Time Analysis” report gives you lane-wise analysis of archived cards each week within a given time period for a board. It also gives you an insight into the Average Work Time, Average Wait Time, etc of your cards for each column of the board. This information helps you to identify the problem area in your organization which in turn allows you to do better planning for the future.
Perform the following steps to view the Lane-wise cycle time analysis report:
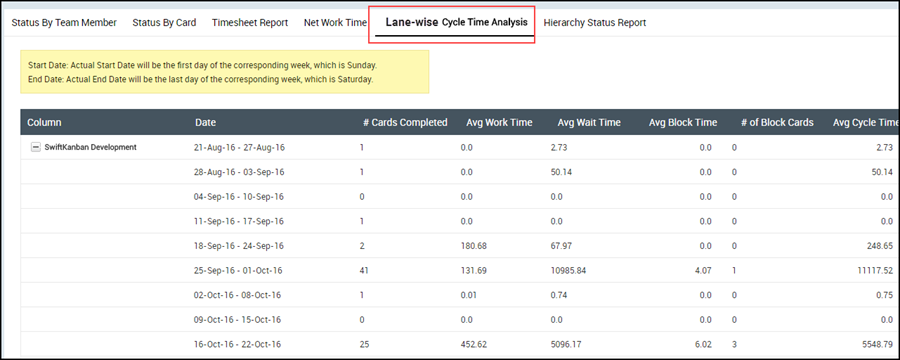
1. Click Main menu>Reports>Lane-wise Cycle Time Analysis tab.
2. Mouse over the Side toolbar and select the Filter icon to specify the date range for which you want to generate the report and click Apply.
3. The selected date range is divided into a period of 7 days each starting from Sunday.
For Example: If the Start Date is 1st Jan 2015 and End Date is 31st Jan 2015 and the first Sunday of the selected date range is falling on 4th Jan 2014 then the report will show data starting from 4th Jan 2015. The report will show data till the last Saturday falling within the selected date range.
4. Click the + icon in front of each column to see the weekly distribution of various metrics provided in the report.
5. Following are different metrics for which the report shows data
- Number of Complete Cards: Displays the total number of archived cards for the given time period
- Average Work Time: Displays the average time spent by the cards in column(s) of the type “In Progress” in the given time period.
- Average Wait Time: Displays the average time spent by the cards in the wait column(s) in the given time period.
- Average Block Time: Displays the average time for which cards were blocked in the given time period.
- Number of Blocked Cards: Displays the total number of blocked cards for the given time period.
- Average Cycle Time: Displays the average sum of time spent by cards in each column.