
In this article, we will help you understand the release planning feature.
|
Skip Ahead to: Steps to Define a Release in Your Board |
Overview
For many of our users who use ‘SCRUM’, or ‘SCRUMBAN’ (a combination of SCRUM and Kanban), the ‘Release Planning’ capability can help the team to plan releases perfectly in an easy-to-use drag-and-drop interface. The teams can define the Release capacity and track the release progress with the built-in visual indicators.
If you have created a product backlog, just drag and drop the cards in the release, depending on the priority and how many story points need to go in a release. You can even increase or reduce the scope of the release, as required, by editing the release.
You can directly push the cards onto the board after scoping it for release, and need not go to the Kanban Board to pull them.
Notes:
-
- The Release Planning feature can be enabled from the ‘Plugins’ page.
- No Release can be created and tracked for a Closed Board.
Steps to Define a Release in Your Board
1. Navigate to the Main menu and select the Release menu from the list of available menus.

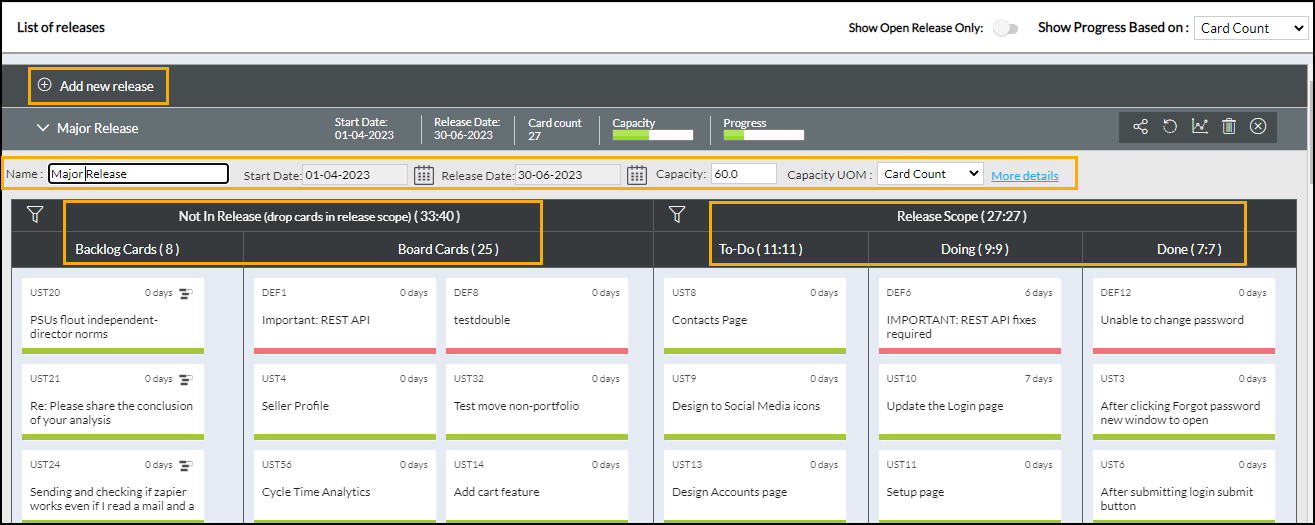
2. In the List of Releases page, click Add New Release. Enter the Name, Start Date, Release Date, and Release Capacity (In StoryPoints, ToDos, or any other UOM defined in the enterprise).
Note: Release name is Mandatory.
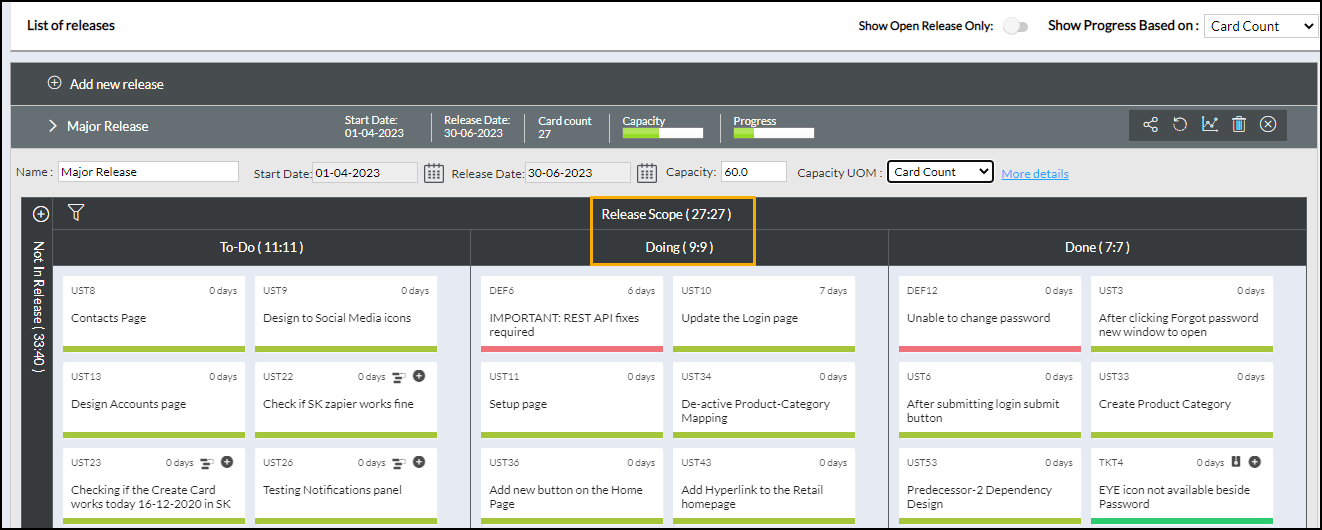
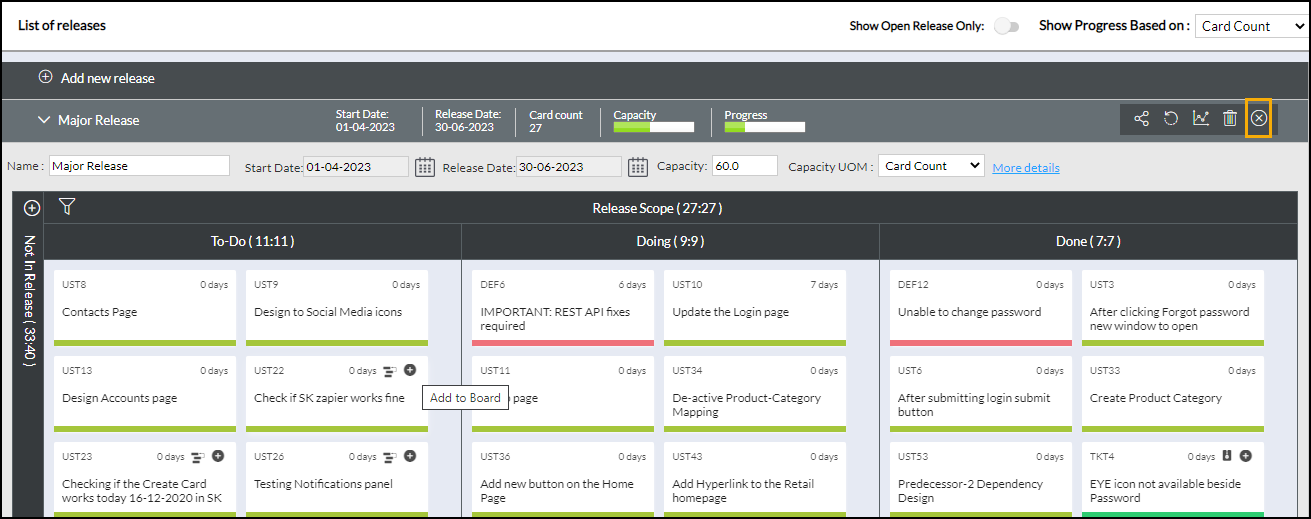
The Release screen is divided into two columns: Release Scope and Not in Release.
The Release Scope is further divided into three columns: To Do, Doing, and Done.
- To Do: Contain cards that are in the Ready and Backlog column type.
- Doing: Contain cards that are in the In-Progress and Completed column types.
- Done: Contain cards in the Done and Archived column type.
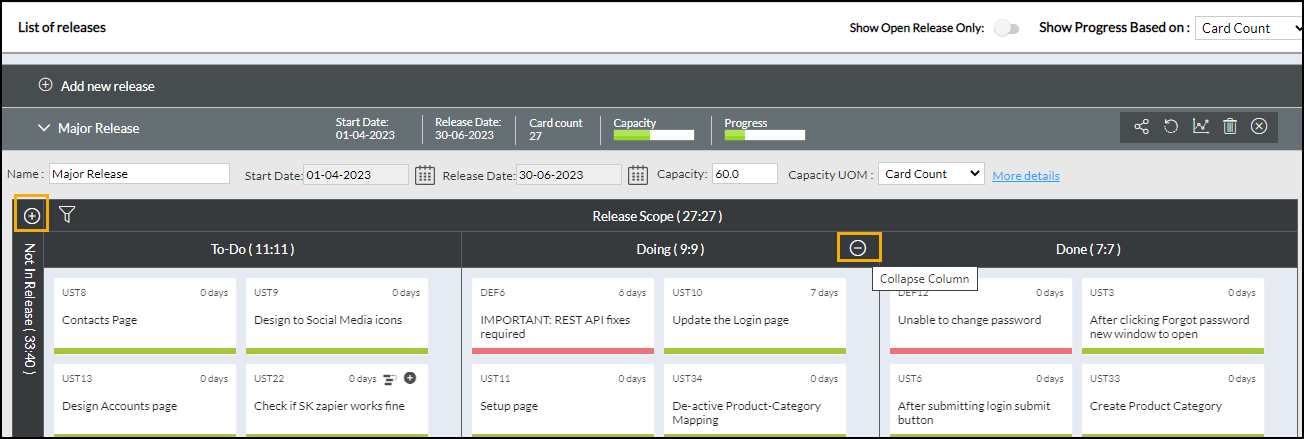
The Release Scope column shows the card count in X: Y format, where Y is the total number of cards assigned to the Release and X is the number of cards after applying the Filter.
For example, in the image below, the Release Scope shows the card count as 27:27, where 27 is the number of cards tagged to the release, and 27 is the number of cards that are shown after applying the Filter on the release scope.
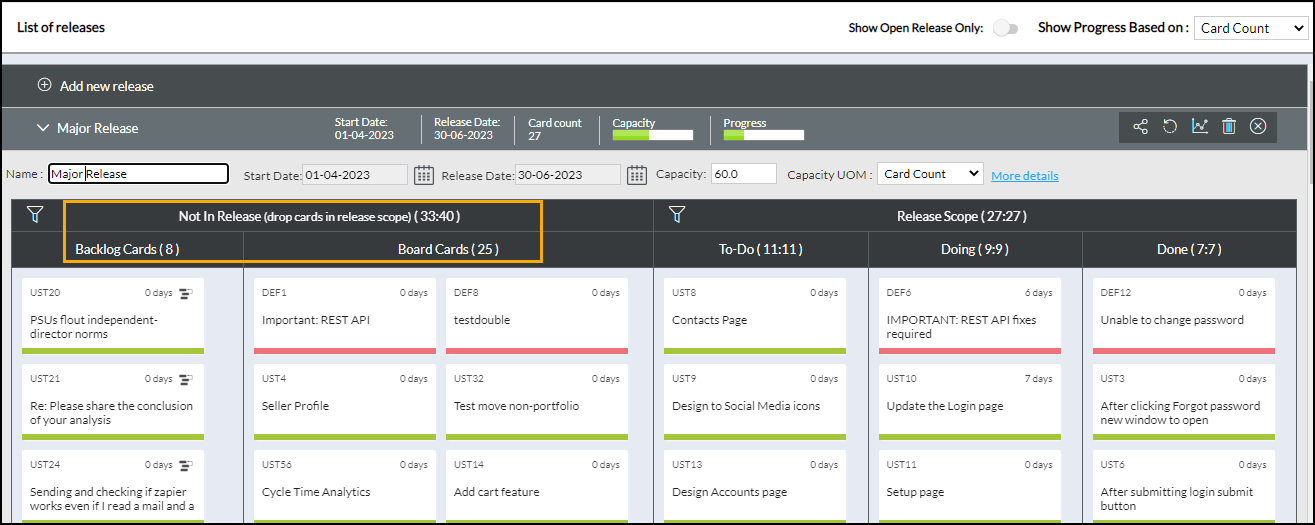
Not in Release is further divided into two sub-columns: Backlog Cards and Board Cards.
- Backlog Cards: Contains cards in the backlog
- Board Cards: Contains cards on the Kanban board
The Not in Release Scope column also shows the card count in X: Y format, where Y is the total number of cards assigned to the Release and X is the number of cards after applying the Filter.
For example, in the following image, cards are shown after applying the filter. So, as shown in the image, the card count is 33:40, which means there are a total of 40 cards that are yet to be tagged to any release, and 33 cards are displayed as per the applied filter criteria.
3. Drag cards from the Not in Release column and drop them under the Release Scope column. The cards you drop into the release bucket will be associated with the release.
- Before you pick up the cards in the column (indicated by a green Status line), you can run through the Card Title and the estimate, or click the card title link to view its details and return to the Release page.
- To locate the card, you may scroll within the column by clicking the page numbers below or clicking the first, previous, next, and last links. To limit the cards in the view, set the card count in the right corner, for example, 25 cards on a page.
- To filter the columns to view specific cards, click the Open Filter on the top left. Type the search string in the filter textboxes or select value(s) from the drop-down list.
- To remove a card added to the Release scope, drag and drop the card back into the Not in Release column. Doing this will disassociate the card from the release but still keep the card active on the board.
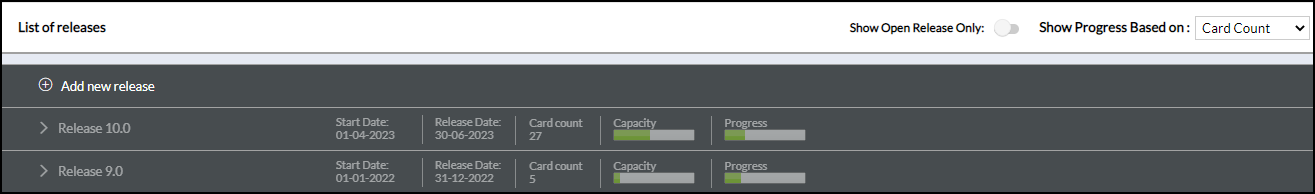
4. If the Show Open Release Only slider button is ON, you can view the open Releases; otherwise, All releases are listed. The list of releases is displayed along with the following details:
- Release name
- Start Date of the Release
- Release Date: The End date of the Release
- Card Count/To-Do Count: Number of cards or To-Dos tagged to the release. The count shown is based on the selection you make from the top-right corner.
- Capacity: How much of the bandwidth of the release is booked? Shown in the Story Points or any other UOM as defined in the Admin. Alternatively, it can be shown in Hours also if the To-Do (Hours) is selected from the top-right option.
- Progress: Depicts the progress percentage of the cards tagged to the release when a card is archived or moved to the Done column.
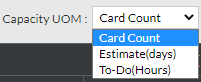
- Capacity UOM: By default, the Capacity of the Release is interpreted in Estimate(days) or any other UOM as defined by the Admin. But, you can also set it to be shown in To-Do Hours or Card Count.
- More Details: Detailed view of the release to add comments or upload, download, or delete attachments.
To view the cards scoped in the past releases, click the release row, and to hide, click it again.
- The number of cards scoped in the release is indicated by the Card Count displayed for the newly added release.
- The Progress bar (green band) for the release indicates the release progress, which shows a percentage of cards archived over the total cards scoped, based on card count. For example, the progress bar in the image below shows 80%.
- The Release capacity indicator denotes to what extent the release is booked (the green band in the capacity bar) or under-booked (the white band in the capacity bar). The bar completely in red indicates that the release is overbooked. On hovering over the Capacity bar, you can view the capacity booking in the percentage that is the sum of the estimates of cards scoped in the release over the capacity entered.
5. You can easily track the overall progress of the cards tagged to the different releases by selecting Card Count, Estimate(days), or To-Do(Hours)as the values for the releases, with Show Progress Based on preference. Thus, you can easily monitor the progress of releases across multiple projects.
A release created will be available in the Release list to be tagged to a card (unless a release is closed). Moreover, you can also tag a release to a card from its edit view by selecting the release from the field with the same name.

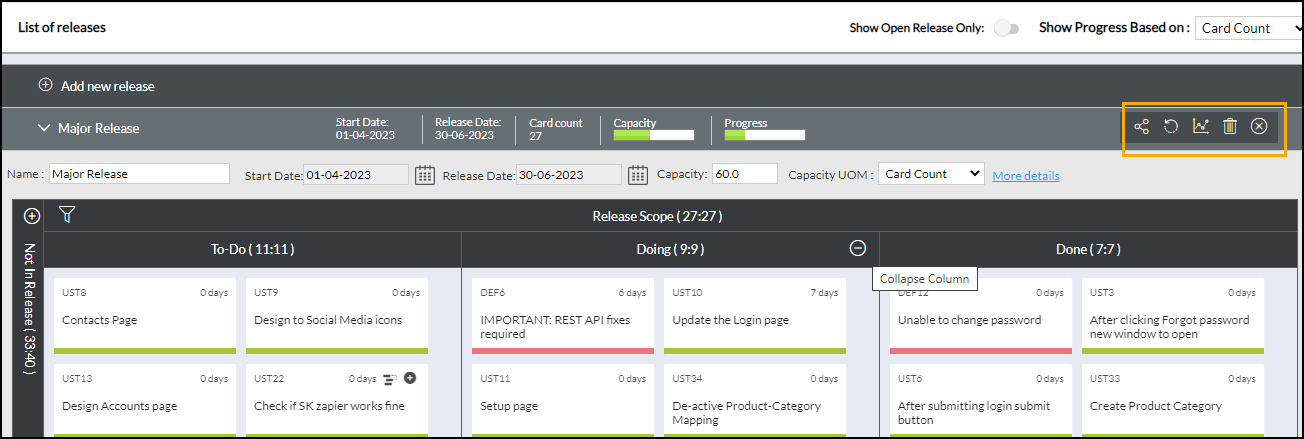
6. To rescope the release, double-click it and drag and drop cards to their respective columns. To go to the Detail view of the release to add comments or upload, download, or delete attachments, click the More Details link. You can expand or collapse the Release Scope and Not in Release columns by clicking the minus/plus on the extreme right of the column, respectively.
To share the release across other boards, click the share icon, and then select the boards that you want to share with. Once the release has been shared, it appears on the Release drop-down attribute of any card across those shared boards.
Note 1: All the cards across other boards that are tagged with the shared release will also be available in the Release Scope panel of the shared release. But, clicking the Burndown chart of that release will show only the data of those cards that belong to the Board for which the release has originally been created.
For example, there is a Board A for which we have created a release, called A1. This release has been shared with Board B. So, the release scope of A1 will have cards that are tagged to release A1 from both Board A and Board B. But, if you look at the Burndown chart of the release A1, it will capture the data of cards that belong to the Board A only.
Note 2: A release cannot be shared with a closed Board. When you click the Share Release icon from a Release, the closed Board is not shown on the Board list. Read here if you are interested in knowing more about the Closed Board.
Note 3: A shared release can be edited only from the board where it was created. When you access the release from a board to which the release is shared, the Edit release icon is grayed out. To add a card to the shared release from any other board, navigate to the Kanban board, open the detailed card view, and select the shared release from the Release drop-down.
To delete a release from the enterprise permanently, click the Delete icon for the required release.
Executing Cards from the Release Scope
After you have defined the scope of the release, you can push the cards directly from the Release Scope.
When you are viewing or editing a release, you can click the Add to Board icon on the card added to the Release Scope. The Add to Board icon will be available for cards in the backlog only.
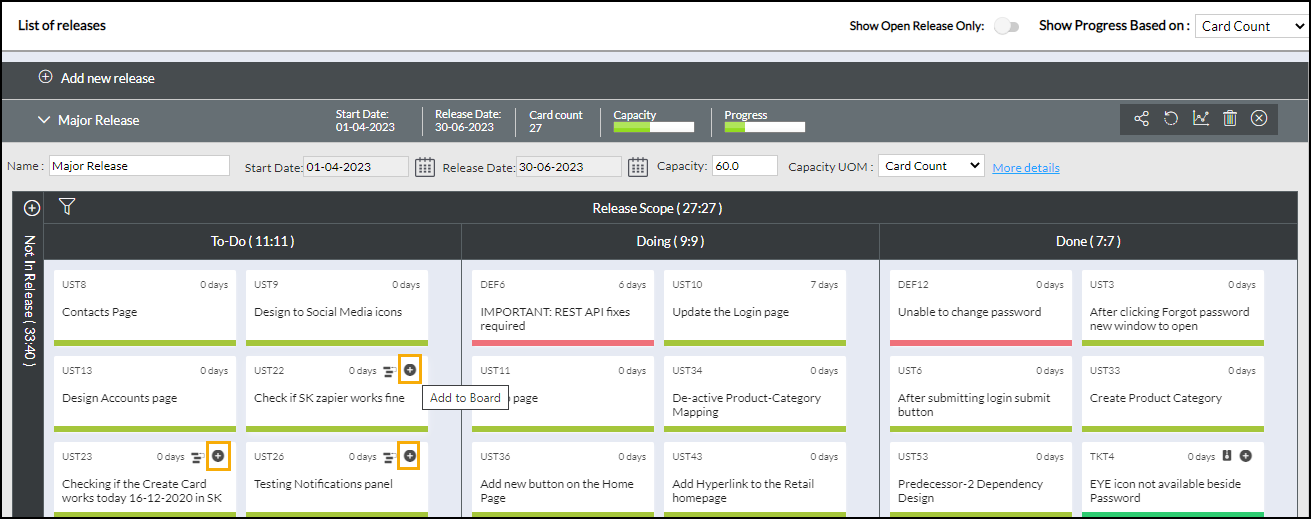
On clicking, it shows up lanes and columns. Click the required lane and its respective column to which you want to move the card.
After adding the card, it will no longer show the Add to Board icon for that card, indicating that the card is already added to the board.
Close a Release
If you don’t want a release to be available for tagging cards to it, you can close, i.e., inactivate the release. To close a release, click the Close icon on the extreme right of the toolbar for the specific release.
When you are adding or editing a card on the board or from its detail view, the release drop-down will not show the release anymore.
If you want to activate a closed release again, click the Open icon for it.
Release Burndown Charts
For SCRUM practitioners, the product provides the Release Burndown chart for the team to track its progress against a release plan in their daily scrum meetings. Burndown charts that can be tracked for any board containing tasks with estimates and actual effort are a graphical representation of outstanding work (or backlog) against time. It is useful for predicting when all the work scope in the release plan will be completed.
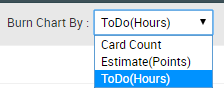
In the product, you can plot the Burndown chart by:
- Estimates ( Unit of Measurement or UOM can be Story Points or any other unit as defined in the Admin)
- To-Do Hours
- Card Count
Now, let us understand how to plot the chart. To view the Burndown chart for a release, perform the following steps:
- From the Board menu, navigate to the Release option, expand the required release by clicking the release row, and click the Charts icon for the release.
![]()
- Select the option from the Burn Chart By field. Based on this selection, the Burndown chart will be plotted, and the Y-axis in the chart will be rendered as per the selected UOM.
Note: By default, it will be the same as the one set in the Capacity UoM field in the Admin Policy.
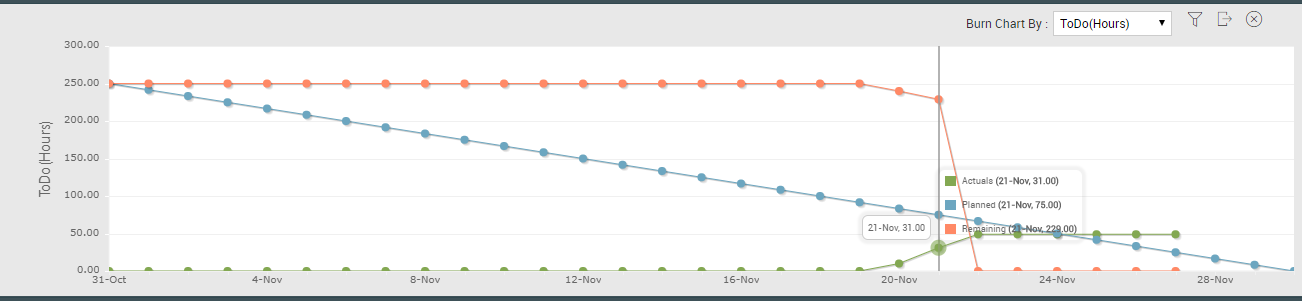
3. The Burndown chart is displayed, showing how the remaining effort comes to ‘0’. This chart is also a burn-up chart if you track the progress of Actual Effort.
4. You can filter the Burndown chart to view it for specific card types. Click the Filter icon ![]() on the chart toolbar. The filter will be applied even for export in MS Excel format.
on the chart toolbar. The filter will be applied even for export in MS Excel format.
5. Moreover, you can also export the chart into MS Excel by clicking the Export icon ![]() on the chart toolbar and viewing it offline.
on the chart toolbar and viewing it offline.
6. Click the Close icon ![]() to close the chart.
to close the chart.
Important Information about Viewing Cards in the Burndown Chart
All the cards across other boards that are tagged with the shared release will also be available in the Release Scope panel of the shared release. But, clicking the Burndown chart of that release will show only the data of those cards that belong to the Board for which the release has originally been created.
For example, there is a Board A for which we have created a release, called A1. This release has been shared with Board B. So, the release scope of A1 will have cards that are tagged to release A1 from both Board A and Board B. But, if you look at the Burndown chart of the release A1, it will capture the data of cards that belong to the Board A only.
Viewing Release or Sprint Burndown Chart by Estimate, To-Do(Hours), or Card Count
Let us understand how the chart is plotted when you select Estimate, To-Do(Hours), or Card Count.
Viewing Chart by To-Do Hours
To view the Burndown chart by To-Do(Hours), the To-Do owners should enter the To-Do Estimates, Actual Effort, and Remaining Effort daily in the cards to track the progress of the Release in the Burndown chart.
You can enable the Time-Tracking Plugin to enter efforts on To-Dos. Effectively, you can see some meaningful data generated on the Burndown Charts. See Logging Effort for To-Dos for details on how team members can log effort for To-Dos.
- Interpret the Actual, Planned, and Remaining values in hours, as team members will be entering daily effort in hours.
- The Release Burndown chart plots the sum of all Daily Remaining Effort (that the To-Do owners enter for cards scoped in the release) on the Y-axis against the dates on the X-axis (from the release start date through the release end date). The burndown slope is the orange line indicating the remaining hours as the release moves through the end date.
- The Release Burnup line (in green) is plotted for the sum of all Daily Actual Effort (that the To-Do owners enter for the cards scoped in the release) on the Y-axis against the dates on the X-axis (from the release start date through the release end date).
- The chart also shows a blue line indicating the planned slope, i.e., how the cards should have ideally been completed through the release. It is the sum of the remaining effort for To-Dos of cards on the release start date through the release end date, closing at ‘0’.
Viewing Chart by Estimate
- To view the Burndown chart by Estimate, the card owner needs to enter the value in the Estimates. Each card in the release will have Estimate points, which will form the basis of Actual, Planned, and Remaining values in the Burndown chart.
- The blue line indicates the slope of how the cards should have ideally been completed through the release. It is the sum of values entered on the Estimates field of the release cards divided by the number of release days. The blue line shows the ideal way of burning the total scoped work from the release start date through the release end date, closing at ‘0’.
- The Remaining or the orange dotted line is calculated based on the total Estimated value of the cards that are still in the Ready or In-progress column.
- Actuals or the Release Burnup line in green color is the total Estimated value of the cards that are either archived or moved to or beyond the Done column.

Viewing the Chart by Card Count
- The Burndown chart by Card Count is plotted based on the number of cards tagged to the release that are archived or moved to or beyond the Done column. The aggregated count of such cards forms the basis of Actual, Planned, and Remaining values in the Burndown chart.
- The blue line indicates the slope of how the cards should have ideally been completed through the release. It is the total number of cards tagged to the release cards divided by the number of release days. The blue line shows the ideal way of completing the cards from the release start date through the release end date, closing at ‘0’.
- The Remaining or the orange dotted line is calculated based on the total number of cards that are still in the Ready or In-progress column.
- Actuals or the Release Burnup line in green color is the total number of cards that are either archived or moved to or beyond the Done column.

Release Burndown Export
The Release Burndown can be exported in MS Excel format, along with the Burndown data. To export the Burndown chart, click the Export icon.
You can open the file in MS Excel or your preferred spreadsheet application. You can click the Filter icon to export the chart and burndown data for specific card types.
