
In this article, we will help you understand the Throughput.
|
Skip Ahead to: |
Overview
In Kanban, Throughput, which is quite similar to the Agile Velocity metric, indicates the amount of work being done in a given period. The unit of work can be interpreted in terms of user stories, story points, or others. Throughput can be a useful indicator in understanding how well the team or the organization is performing against the lead time and the target delivery date, and turning stories into working features.
Using the product, you can measure throughput in terms of the number of cards delivered for a specified period. You can also track the break-up of the cards delivered, based on a specific attribute such as priority, class of service, size and so on. The SCRUM team can effectively plan a Release or Sprint by measure throughput in terms of card estimates or points delivered in a Release or Sprint.
So, you can drive following key information from this Throughput chart:
- Track how much effort your team has reported as complete for each release or time period.
- Estimate how much backlog effort your team can handle in future releases/time period if your team composition and duration stay constant.
Throughput Filter
On the Throughput page, click the Filter icon on the Side toolbar. Select the following options in the filter pop-up, and click Apply:
- Start and End Date: Select both these dates from the calendar to limit the scope of data.
- Time Period: Snapshot of time (Daily, Weekly, Monthly, Quarterly, and so on) for Throughput to be rolled on the X axis of the chart.
- Plot Chart By: Select the option to view the break-up based on card count or card estimates on the Y axis of the chart. Card estimates are calculated based on the Estimate attribute value (as selected in preference by the enterprise) being updated in individual cards.
- Stacked By: Select the option (Priority, Class of Service, Card Type, and so on) based on which you want to stack the chart bar
- Card Type: Select the Card Type for which you want to plot the chart.
- Lane: Select the lanes from the list box for which you want to plot the chart.
- Start and End Column: Select the exact stages for which you want to generate by defining the Start Column and End Column.
Note: The chart considers the cards that have exited the End Column or moved to or beyond the Done column type in the date range, and also cards that may have skipped the Start Column through the End Column. Throughput is calculated based on the time the card entered any column between the Start column and the End column to the time it was moved out of the End column. But if the End column is tagged as a Done column type, then the throughput is calculated till the card’s entry into the End column, not based on its exit from the End column.
If you select all or multiple columns for plotting the chart, then the throughput is calculated based on the archived cards and any cards that enter into the Done column type or move beyond Done column type.
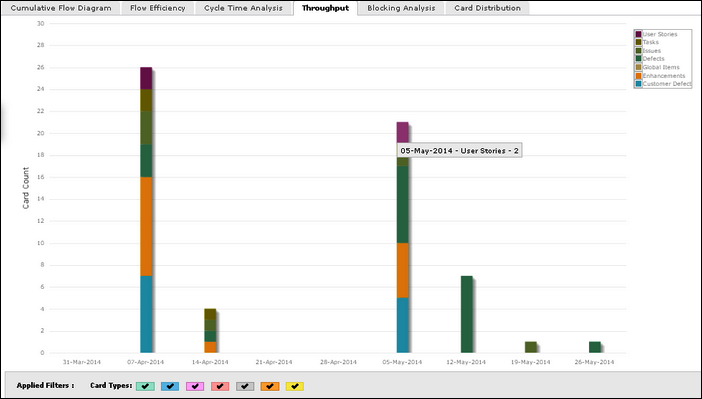
On the Throughput chart, hover over a bar to view the attribute and the throughput number. The drill-down capability on the Throughput chart helps you analyze the completed cards that contributed to the Throughput number. Click the bar to see the list of completed cards in a pop-up. You can go to the card details by clicking on a card on the list.