
In this article, we will guide you about the To-Do Data Analyzer.
|
Skip Ahead to: Key Features of the To-Do Data Analyzer |
Overview
The To-Do Data Analyzer is a powerful data summarization feature that you can use to quickly summarize your To-Do’s progress through various statuses, offering valuable insights into card completion data in a tabular or chart format.
Using this highly scalable analytics, you can extract voluminous data from different boards within an organization and visualize them in a tabular or chart format to monitor the data trends. Moreover, you can refine the To-Do data based on a specific period. Also, design and modify the analytics based on various attributes.
You can use the ToDo Data Analyzer both at the Organization and Board level.
Key Features of the To-Do Data Analyzer
- Visualize the to-do progress through various statuses at the Board and Organization level.
- Refine the data by specifying the period of the analytics, by setting the start and end date.
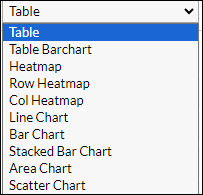
- Select the type of table or chart from the variety of options, such as Table, Bar Chart, Line Chart, Bar Chart, Heatmap, Row Heatmap, and so on.
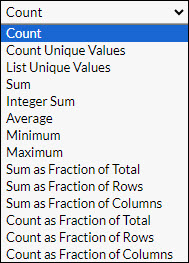
- Select the method of summation such as Count, Sum, Average, Minimum, Maximum, 80% Upper Bound, Sum as Fraction of Total, and so on.
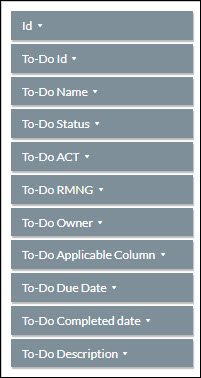
- Some default To-Do attributes will be already selected like To-Do ID, To-Do Name, To-Do Description, To-Do Status, etc. whenever a To-Do is created for any card on the Board.
- Also, you can drag and drop other attributes like Card Types, Class of Service, Priority, Created By, etc. according to your requirements.
- Save your table or chart with a unique name and reuse it later to visualize a similar type of information.
- Access the analytics offline by exporting the tabular graph into Microsoft® Excel.
Navigation
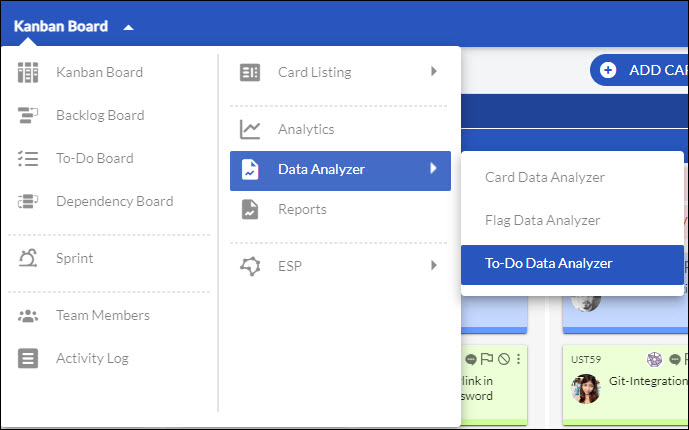
To navigate to the To-Do Data Analyzer at the board level, go to the Board menu, select Data Analyzer, and then select To-Do Data Analyzer.
To-Do Data Analyzer at the Organization Level
- To access the ToDo Data Analyzer at the organization level, click the More Options icon on the control panel, click Dashboard, and then click the ToDo Data Analyzer link.
- Select the Board Status for which you would like to generate the report. You can select any of the options: Active, Closed Boards, or both of them. Read this Help page to know more about the Closed Board.
- Select the Board(s) and the Card Type(s) for which you want to generate the Pivot analytics. Both of them will be available based on the selection you made for the Board Status field. For example, if you have selected Active Boards only, then all the active Boards and their Card Types will be available in the drop-down.
- To refine the ToDo data as per the status of the card Active(Default) and based on custom date fields like To-Do Created On, To-Do Last Updated On, To-Do Completed Date, To-Do Due Date, Planned Start Date, Planned End Date, Resolved On, Reported Date, or any customized field select the option listed under the Date Field option.
- To view the ToDo analytics for a specific period, enter the Start and End date and click Go. Note: The ToDos that are modified between the Start and End Date will be considered in the Analytics.
- Select the table or chart format from the drop-down list.
- Select the summarization method such as count, average, sum, and others from the drop-down list.
- To plot the table or chart, drag and drop the required attributes to the Row and Column level.
- You can further refine the data by selecting the specific values of an attribute. To filter and select the required values, click the arrow icon in the attribute box, select the required options, and then click OK.
- To save your current table or chart, click the Filter Settings icon, enter a unique name in the Save as New field, and click Save As. You can access the same table or chart later by selecting that name from the Filter drop-down list.
- To modify any existing table or chart, select the same from the Filter drop-down list, make the necessary changes, and then click Save. To delete the table or chart, click Delete.
- To export the table into Microsoft® Excel, click the Export icon.

To-Do Data Analyzer Attributes
Let’s understand some of the attributes of the To-Do Data Analyzer at the Organization level. As a manager overseeing multiple boards—such as Development and Testing—you must track User Stories and Defects to assess progress. For the past two weeks, you want to understand how much work has been completed (actual hours) and how much work remains (remaining hours) across all To-Dos.
- To-Do Actual Hours
- This attribute allows you to analyze the actual hours logged for each To-Do.
- Eg: If a User Story card has 3 To-Dos, each with 2 hours logged, the report will show 3 separate rows for this card, each displaying 2 hours in the To-Do Actual Hours column.
- To-Do RMNG Hours
- Use this attribute to track the remaining hours for each To-Do.
- Eg: If a Defect card has 2 To-Dos, with 5 hours and 3 hours remaining, the report will show 2 rows with the respective hours (5 and 3) in the To-Do RMNG Hours column.
- Card Total To-Do Actual Hours
- This attribute summarizes the hours logged across all to-do’s within a card.
- Eg: If a User Story card has 4 To-Dos with actual hours logged as 6, 4, 3, and 7, the report will show one row for the card, with a total of 20 hours in the Card Total To-Do Actual Hours column.
- Card Total To-Do RMNG Hours
- This attribute summarizes the remaining hours across all to-do’s within a card.
- Eg: If a Defect card has 5 To-Dos with remaining hours as 2, 1, 3, 0, and 4, the report will show one row for the card, with a total of 10 hours in the Card Total To-Do RMNG Hours column.
Choosing the Right Attribute
While choosing these attributes keep this in mind:
- To-Do Actual Hours or To-Do RMNG Hours is a row-wise breakdown of hours logged or remaining for individual To-Dos.
- Card Total To-Do Actual Hours or Card Total To-Do RMNG Hours is a consolidated view that summarizes the total hours for a specific card, regardless of the number of associated To-Dos.
To-Do Data Analyzer at the Board Level
- Navigate to the To-Do Data Analyzer at the board level.
2. To refine the To-do data as per the status of the To-Do Active(Default) and based on custom date fields like To-Do Created On, To-Do Last Updated On, To-Do Due Date, Planned Start Date, Planned End Date, Resolved On, Reported Date, and more, alongside To-Do attributes. Select the option listed under the Date Field option. Thus, you can easily filter and analyze To-Dos more effectively based on creation, updates, due dates, or completion, making your data analysis more relevant and actionable.

Then, specify the period to refine the To-Do data. Set the Start date and End date and click Go. The To-Do Data Analyzer will consider all the To-Dos created or modified between the Start and End date.
3. Select the table or chart format from the drop-down list.
4. Select the summarization method such as count, average, or sum from the drop-down list.
5. To plot the table or chart, drag and drop the required attributes to the Row and Column level.
6. If a To-Do is already created for a card on the Board, then some default attributes are already selected such as To-Do Id, To-Do Name, To-Do Description, To-Do Status, etc.
7. Apart from the default To-Do attributes, you can also select other attributes for better analysis.
8. To save your current table or chart, enter a unique name in the Create New Filter field, and click Create. You can access the same table or chart later by selecting that name from the Filter drop-down list.
9. Click the number to drill down any number to view the To-Dos that contribute to it. The associated cards are displayed as a list. To get the details of any To-Do, click the card ID or title from the list.
10. To modify an existing table or chart, select the same from the Filter drop-down list and make the necessary changes. It will autosave the filter.
11. To delete the table or chart, select the filter and click Delete.
12. To export the table into Microsoft™ Excel, click the Export icon.