
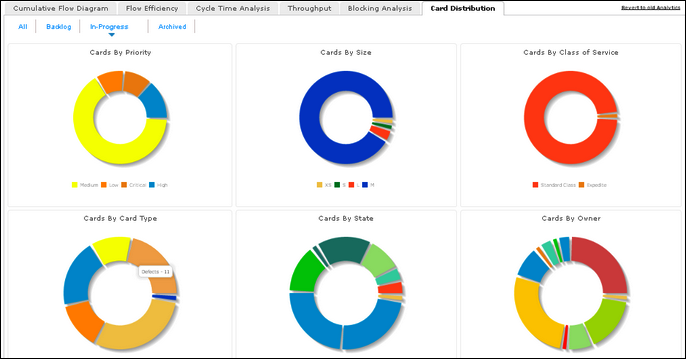
The pie-charts give a bird’s eye view on the distribution of cards visually, based on key attributes such as:
- Cards by Priority: For example, Cards of High priority over cards of all priorities
- Cards by Size: For example, Cards of size XL over cards of all sizes
- Cards by Class of Service: For example, Cards with Expedite type of CoS over all cards
- Cards by Card Type: For example, Defect cards over All card Types
- Cards by State: For example, Cards in Dev-In-Progress column /state over total cards on the board, including Archived and Backlog.
- Cards by Current owner: For example, Cards owned by Team Member A, over all cards owned, including Unassigned
There are no filter options to be set, but there are four different views. To switch to different views, click the tab you want.
- All: Includes cards in the Backlog, active on the board, and closed
- Backlog: Includes cards in the backlog
- In-Progress: Includes cards on the board
- Archived: Cards that are archived from the board.
The legend is displayed below pie-charts in the view, wherever applicable).
Hover over a pie to see the card count for an attribute value. For example, on hovering over the orange pie in the ‘Cards By Card Type’ chart in the In-Progress view, you can see that 11 cards are Defect cards in progress.
Note: The Backlog view does not show the pie chart for ‘Cards By State’ and the Archived view does not show ‘Cards by State’ and ‘Cards By Owner’.