
In this article, we will help you understand about the Roadmap widget.
|
Skip Ahead to: Plotting of Planned Bar and Actual Bar |
Note: From the 8.11 release onwards, the Timeline Progress widget will be renamed as the Roadmap widget.
Overview
While working on large products, a product owner often works on more than one board initiative (like themes and epics in our case). While developing big initiatives parallelly, it becomes challenging to remember their scheduled duration and deadline. Also, if any feature is getting delayed for some reason, then it becomes difficult to measure that delay which may cause serious repercussions.
To handle these kinds of situations, which are quite common in product management, it becomes very important to have a visual overview of the schedule of your board initiatives along with their deadline. And that is where the Roadmap Widget can help you.
The Roadmap widget offers you a visual overview of your initiatives’ progress at a glance in a precise way. It helps you see which card/Release/Sprint is planned for what duration, and how it is progressing. Also, based on the current pace of the card’s progress, it shows the potential slippage in its completion so that you can take necessary actions on time
With the Roadmap widget, you can view the following information:
- The various board initiatives like Theme, Epic (along with their child cards), or Delivery Cadences like Release or Sprint.
- The planned duration of each card/release/sprint
- The actual progress of each card/release/sprint against the planned duration.
- When each card begins and ends
- Any potential delay in the completion of the card
- Percentage of work done till current date
- Percentage of slippage in completion (if any)
- The predicted end date of a card if it is getting delayed
To summarize, the Roadmap widget shows you the current status of your cards or Releases/Sprints against how it was planned so that you can take necessary action to ensure the timely delivery of your product.
Rendering of Roadmap widget
On the left of the widget is the hierarchy of the card or release (whichever is selected in the filter panel) and along the top is a timescale in weekly (for release) or bi-weekly (for cards) format. If the cards in the hierarchy are from multiple boards, then the legend for each board is shown above the hierarchy. And the cards are highlighted with their board legend to show which board they belong to. If the cards in the hierarchy are from the same board, then no legend will be shown.
Note: The legends will be shown only if the Roadmap Progress widget is opened in the Maximize view.
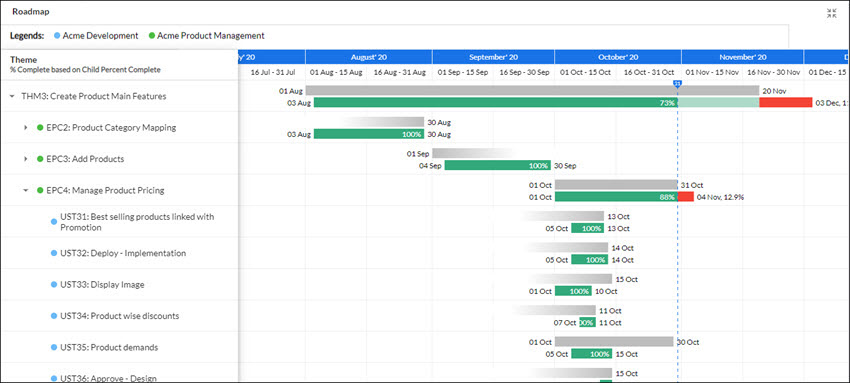
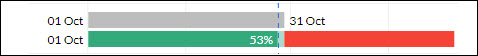
Against each card or release, two bars get plotted. The position and length of the bar reflect the start date, duration, and end date of the card. The left end of a bar represents the start date and the right end of the bar represents the end date. The vertical blue line shows the current date as the entire widget gets plotted with respect to the current date only.
Planned bar
The first/upper bar (in grey color) against a card is the Planned Bar which shows the planned duration of the card. The Planned start date and Planned End date are plotted according to the values entered in the Planned Start Date and Planned End Date fields on that card.
You can set or edit the Planned Start Date and Planned Finish Date of a card by adjusting the start point and endpoint of the planned bar respectively. To modify the planned dates, hover over the start or the endpoint of the planned bar and drag the modifier on the widget to set the new date.
Actual Bar
The second/lower bar (in green color) against each card is the Actual bar which shows the actual progress of the card.
Actual Start Date
The Actual Start date is the date on which the card starts getting executed. This Actual start of a card depends on the card % progress preference set for that card.
If the “% Complete Preference” for the Card Type is “Manual” or “Percentage of ToDos Completed” or “Percentage of ToDo Effort Completed” then the Actual Start Date is whichever of the following two dates are earlier:
- Earliest approved timesheet entry date against the ToDos of that card OR
- The first movement of that card into an “In-Progress” type of column on the Execution Board.
Note: Whatever is the earliest movement into an “In Progress” column across other lanes is considered for the Actual Start date for the card.
If the Card Type “% Complete Preference” preference is “Child Percent Progress”, then the Actual Start date is derived from one of its child cards which have the earliest date based on the above-mentioned points- A or B.
Actual End Date
The Actual End Date is the date on which the card is completed and moved to the ‘Done’ type of column on the Execution Board.
Percentage inside the Actual Bar
The percent shown inside the actual bar shows how much work of that card is done. The Percentage of the work is measured according to the ‘Card % Progress’ preference selected for that card in the Execution Board.
For example, if the Card % Progress preference selected for the card is “Child Percent Complete”, then the work percentage on the actual bar will be calculated according to its closed children cards. Similarly, if the Card % Progress preference is “Percentage of My Card ToDo completed” or “Percentage of My Card ToDo Effort completed” or “Manual”, the work percentage will be shown as per the count of closed ToDos or effort logged against closed ToDos or manual percentage, respectively.
If the card starts after its Planned End date, then the work is considered as a 100 % spillover and the actual bar is shown in red with its percentage on it.
Slippage Bar and Predicted End date
If the actual progress of the card does not go according to the Planned bar and the work gets stretched beyond the Planned End date then the Roadmap widget predicts the slippage in the completion of the card and shows the Predicted End date in red color next to the bar.
Predicted End Date = (Current Date – 1) + (Days Required to Complete at Current Velocity)
Where “Days Required to Complete at Current Velocity” = Total Open Cards / Current Velocity
Note: Predicted End date is displayed only if at least 25 percent work of that card is done.
Slippage percentage at the end of the Bar
The slippage percentage of a card is measured according to the delay in finishing the work against its planned date. It is shown in red color next to the predicted end date.
The slippage percentage is calculated as given below:
Slippage Percentage = No. of days delayed /Planned Duration of the Agile Workitem X 100
Where
No of days delayed (for a closed card) = Actual End Date – Planned End Date
No of days delayed (for an open card) = Predicted End Date – Planned End Date
Plotting of Planned Bar and Actual Bar
Plotting of Planned Bar
Plotting of the Planned Bar depends on the value of the Planned Start Date and Planned End date of the card. If any of these values are not present, then the Plotting of the bar is impacted as mentioned below –
| Planned Start Date | Planned End Date | Planned Bar |
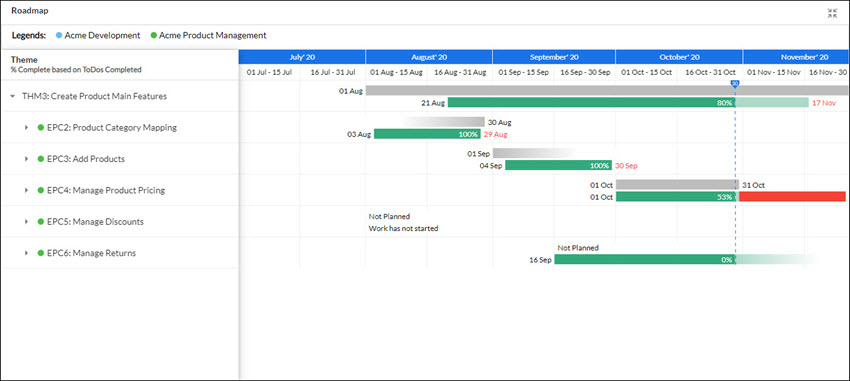
| Available | Available | If the planned start and end dates are available, then the planned bar will be in grey color as per their dates as shown against EPC4 in the hierarchy in the image below.
|
| Available | Not Available | If the Planned Start date is available and the Planned End date is not available, then the planned bar will start from the planned start date and fade out towards the Planned End date as shown against EPC3.
|
| Not Available | Available | If the planned start date is not available and the Planned End date is available, then the planned bar will start with gradient/faded color and end on the Planned End date on the Roadmap widget as shown against EPC2.
|
| Not available | Not available | If both Planned Start date and Planned End dates are not available, but Sprint dates are available, then the sprint start date is considered as Planned Start date and the Planned End date is considered as sprint end date, so the planned bar is plotted as per the sprint duration.
if the card is also not tagged to a sprint but to a release then the Release start date is considered as the Planned start date and the Release end date is considered as the Planned End date and the planned bar is plotted accordingly. If Release dates are also not available, then the planned bar won’t be shown and instead, a message <Not Planned> would be shown in its place as shown against EPC5. |


Plotting of Actual Bar
Plotting of the Actual Bar depends on the value of the Actual Start Date and Actual End date or Predicted End date of the card. If any of these values is not present, then the Plotting of the bar is impacted as mentioned below –
| Actual Start Date | Actual End Date | Actual bar |
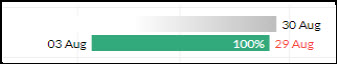
| Available | Available | If the card has started and completed without any delay as it was planned, then the bar will be in the green color. The actual start and end dates of the card will be shown at both ends as shown in EPC2 and EPC3 in the above image.
|
| Available | Not Available | If the Actual start date is available but end date is not available as the card has not been completed, then the actual bar starts with the actual start date and gets plotted till the current date and after the current date, it starts fading.
But if the card is 25 percent or more is completed, then the Roadmap widget will predict its end date according to the current pace of the card and show the predicted end date instead of the actual end date as shown in EPC4.
|
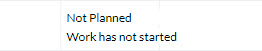
| Not Available | Not Available | If the card has not started and hence both Actual start date and End date are not available, then the actual progress bar will not be plotted and instead, the text <Work has not started> will be shown as shown in EPC5.
|


Dependency View in the Roadmap Widget
The dependency view in the Roadmap widget helps you see the dependencies between cards present on the board. The dependencies among the cards are represented by the dependency links.
The card which is dependent on the other card is called the Successor and the card on which the other card is dependent is called the Predecessor.
The color of the dependency links is drawn according to the dates (Done date, Due date, Sprint date, and Release date) available on the cards. To know more about the dependency links and their color, read here.
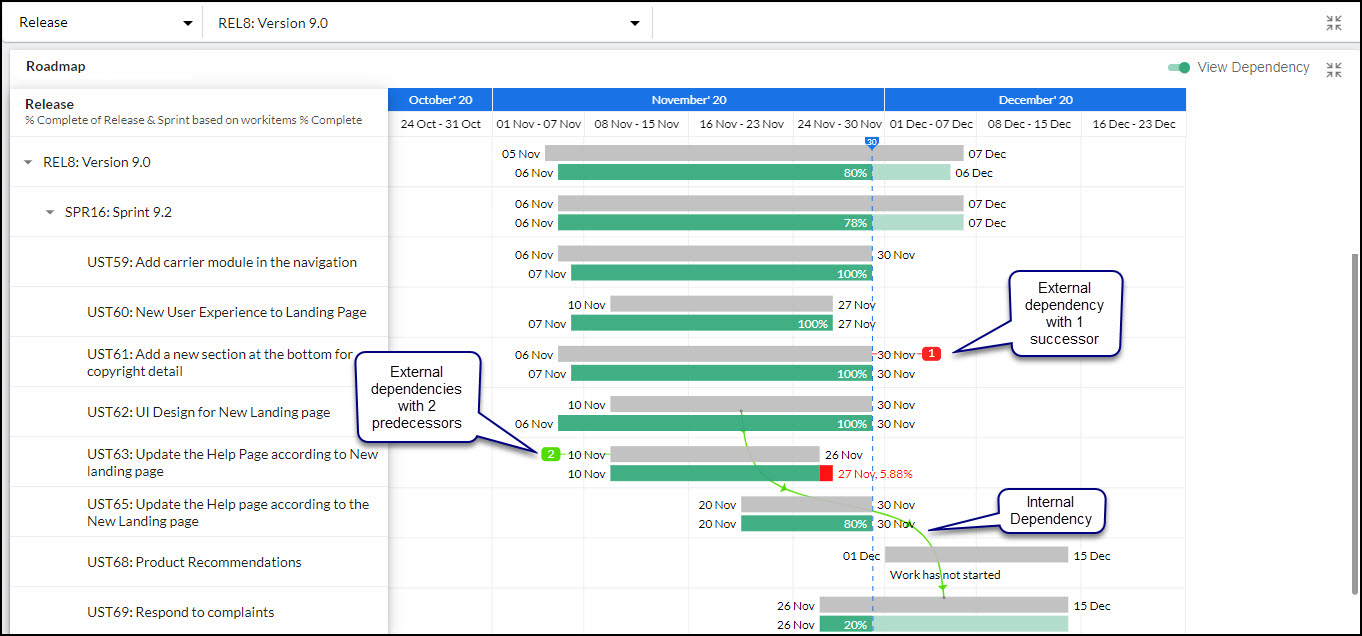
1. The Dependency links are drawn on the Planned bar from the predecessor card towards the successor card.
2. If a card’s predecessor or a successor is not present on the board, then it will show the count of the predecessor card on its left and the count of the successor card on its right side.
3. Clicking the count of dependencies will open the Dependency view of the main card.
4. If a predecessor or successor of a card is collapsed in the hierarchy, then too, the count of the predecessor and successor card is shown on its left and right side respectively.
Minimized View of Roadmap Widget
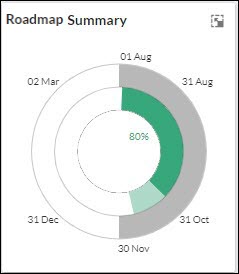
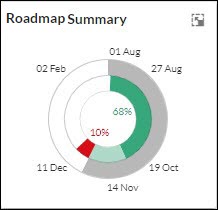
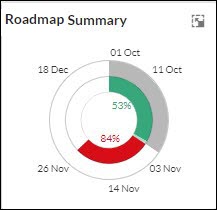
The minimized view of the Roadmap widget shows the Planned and Actual bar of the parent card in the hierarchy.
It is represented in a clock from where dates are plotted on the 12 o’clock point, 6 o’clock point, and at the middle of four quarters so that the date range of Planned and Actual Bar can be estimated easily.
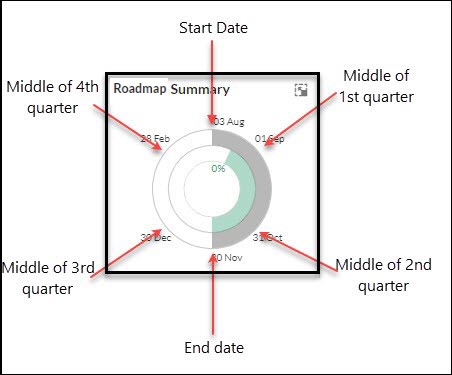
The 12 o’clock point of the clock is considered as the Start point for Planned Start and Actual Start date (whichever is earlier). And the 6 o’clock point is considered as the Endpoint for the Planned End and Actual End date. But if there is a slippage in the card, then the Planned Bar is adjusted in such a manner that the slippage doesn’t cross the middle of the third quarter in the widget.
In the middle of the chart, the actual percentage and slippage percentage (if any) are shown.
| With no slippage – | With minimal slippage – | With Significant slippage – |
 |
 |
 |