
Using the Work Type Distribution widget, you can view the distribution of card types in a hierarchy or those tagged to a Release or Sprint. Based on the card instance (Epic, Theme, User Story, and so on) or delivery cadence (Release or Sprint) selected in the Filter panel, the circular chart (resembling a donut chart) shows the distribution of the cards under a hierarchy in colored slices. Each slice or portion represents different types of child cards in that hierarchy.
The area of a slice representing a particular card type is plotted according to its percentage in the overall hierarchy. Hovering over the chart shows the name of the card type along with the count of instances belonging to that card type.
The color of the slice for a card type is the one set for that card. For more information related to adding color to your card tye, click here.
No matter whether a card is at level 2, level 3, or at the bottom level in the hierarchy, it will be plotted in the chart according to the percentage of cards.
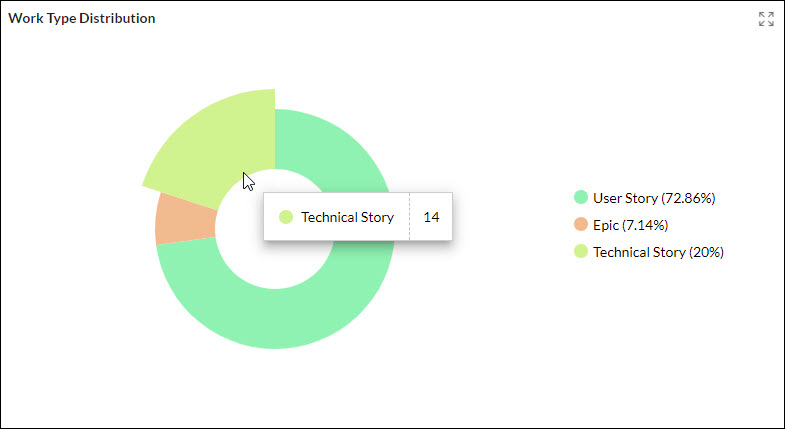
For example, in the given screenshot, the parent card is a Theme having 5 child cards as Epic and each epic has some technical stories and user stories tagged to it. The three colored portions represent the percentage of Epic, Technical stories, and User stories under the theme, respectively.