In this article, we will help you understand the Tag Cloud.
|
Skip Ahead to: |
Overview
The Tag Cloud metric gives you a collocated visual view to understand what are the key drivers of your board. Hence, if you assign tags to a card such as customers, technologies, specific themes, etc., you can analyze the biggest drivers for your deliverables.
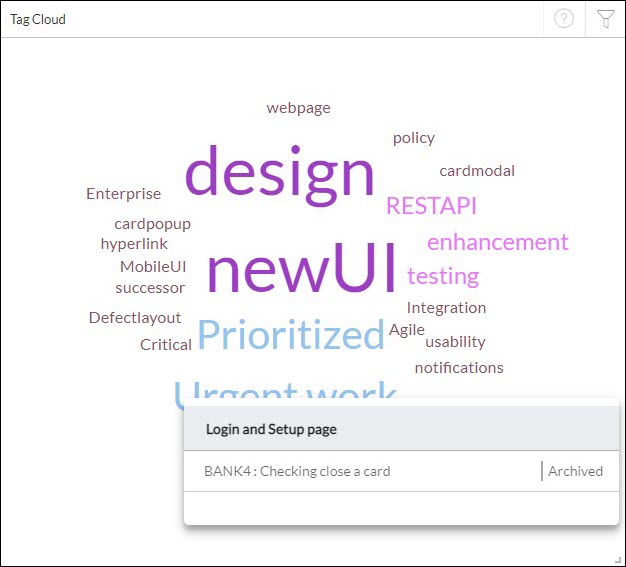
You can assign as many tags as you need to a card. Click the Tag Cloud tab in the Analytics view, various tags appear in different font sizes and colors. The arrangement is such that the most popular tag is in the center and with reduced popularity, these are dispersed in various colors farther away from the center tag.
The Tag Cloud can be used for navigation to view a list of connected stories/cards. Click the tag to view a list of cards that are using the tag. On selecting a card from the list, the card pop-up appears in the read-only view. The metric can be used to summarize search results in finding content more quickly and from a different perspective altogether.
Note: There is no filter as of now; tags are shown for cards that are active on the board, backlog, and archived. Thus, the list includes all cards except, those that are deleted.
As and when tags are deleted and new tags are added to a card, a Tag Cloud chart will be generated based on the frequency when you return to the chart.
Apply Filter
The filter option in the Tag Cloud metric helps you to fetch tags based on the filter criteria selected like Start Date, End Date, Date Field, Card Type, etc. To apply the filter on the Tag Cloud:
- Click the Filter icon.
- Select a Start Date and End Date for the filter.
- Select the Date Field value as Created On, Due Date, or Done Date.
- You can also select other filter options such as Card Type, Size, Class of Service, and Priority as per your need to filter the tags.
- Then, click the Apply button.
- Now, you can see the tag results as per the filter applied in the Tag Cloud metric.