
Enhancements in ESP Analytics
We have introduced a couple of enhancements to Cycle Time and Flow Efficiency charts in SwiftESP Analytics that enable you to visualize percentiles in the histogram and percentile as well as rolling average in scatter plots.
Once you enter the percentile values and apply on the Histogram and Scatter plot chart of both these analytics, the dotted lines demarcate the area of observation. Each area between the dotted lines represents the percentile value below which a percentage of average cycle time or flow efficiency data falls.
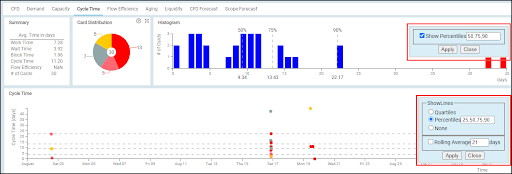
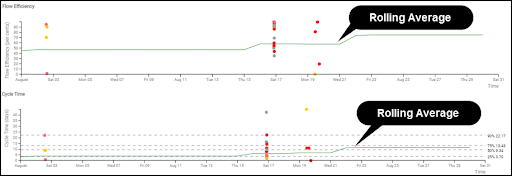
You can also plot a line based on the rolling average of the cycle time or flow efficiency for the n number of days. The rolling average is the moving average of the cards that exit the selected region of the value-stream during the selected time interval. The line is formed by joining the series of data points of the average cycle time or flow efficiency for a given time interval. It not only helps you understand the trend of the cards getting done but also visualize the emerging pattern and detect any intermittent peak.
Moreover, We have also enhanced the Monte Carlo simulation for the CFD forecast to allow for user-defined start date and duration of forecast. To know more about the ESP Analytics, read here.
Note: ESP Analytics is available only to SwiftESP paid subscribers.
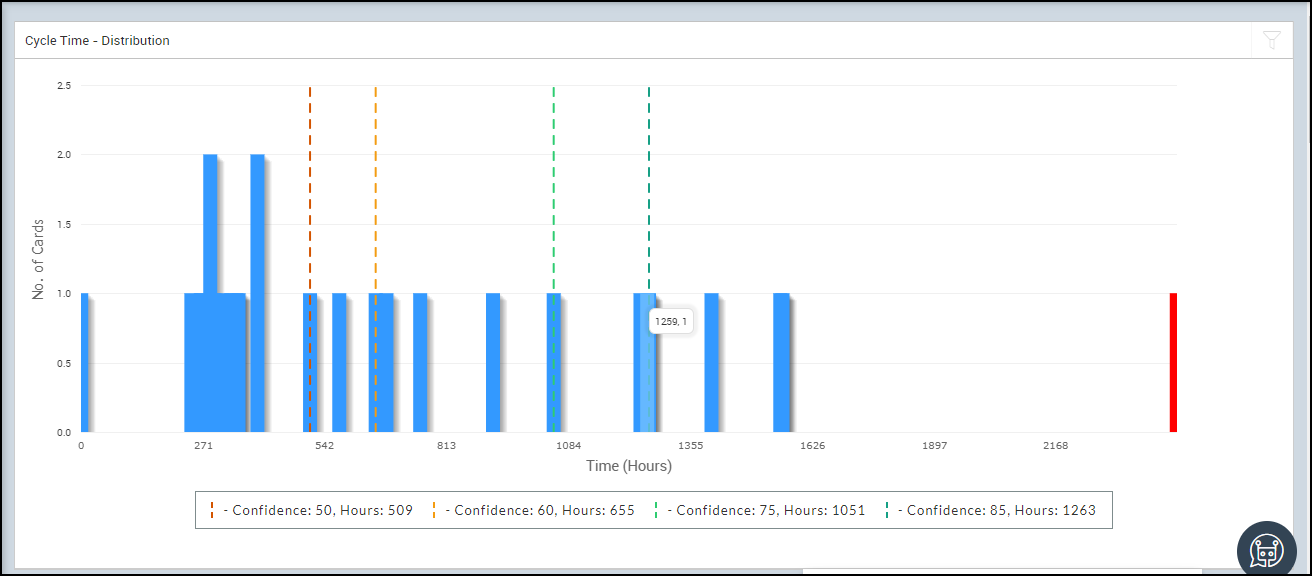
Viewing Frequency Distribution Chart in Percentile
We have enhanced all the Frequency Distribution Charts ( Cycle Time, Work Time, Wait Time and Blocked Time) that now enable you to visualize percentiles in the histogram. Once you enter the percentiles (in comma-separated values) in the Confidence Interval field and apply on the chart, the vertical dotted lines demarcate the percentile value below which an average cycle time or wait time data falls.
By looking at those colored dotted lines, you get an understanding of how the frequency of cards getting completed or blocked or worked upon is distributed based on the percentile values. Get to know more about this chart here.
Add Card in a Specific Column with the addCard Webservice
From now on, addCard method (SOAP) and post method of CardService (REST Url: /card-operations/boards/{boardId}/cards) of webservice will add cards based on the Board Policy of the default lane configuration.
Like web application, If the default column for card addition in the Board policy is not set, then the card, added via the SOAP or REST webservice will be placed in the Backlog. If the policy is set to a specific column then the card will be added in that column only.