*** This is a licensed feature. Please contact us at [email protected] to know how to avail it.
Enterprise Services Planning (ESP) represents the body of knowledge that helps decisions makers such as senior executives, portfolio managers, and risk managers use their Kanban-based systems’ actual performance data to understand the customer demand on their systems, their systems’ delivery capability, and use that to forecast their future performance at various levels of confidence.
ESP taps into the Kanban system’s lead/ cycle time data and related flow metrics to help management take informed decisions with greater reliability and predictability. It also encompasses portfolio/ risk managers regularly evaluating and rating various portfolio elements such as strategic initiatives, programs, and projects, and systematically using that to prioritize the right set of these elements for execution. SwiftESP provides all of this capability as an add-on module on top of the SwiftKanban Enterprise license.
For more information about Enterprise Services Planning, visit the SwiftESP page on our website.
Note: After purchasing the ESP Analytics module, you need to enable it. To know more about enabling ESP analytics, see this section.
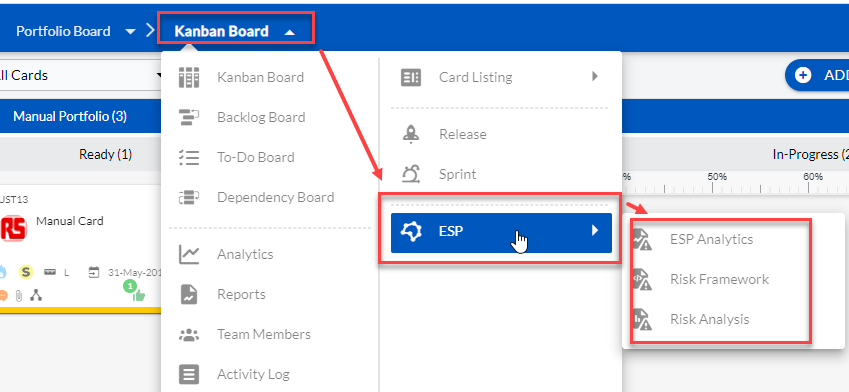
Navigating to ESP Analytics
From the Kanban Board menu, go to ESP > ESP Analytics.
Exploring ESP Analytics
Explore the following ESP analytics, and get a detailed idea of how you can plot the chart, read and interpret the diagram, and leverage your understanding to take future business decisions.
- Cumulative Flow Diagram(CFD): Indicates how much work is done, ongoing, and in backlog, and what is the pace of progress
- Demand: This shows the amount of work being accepted into the Ready column of your Kanban board at a different time stamp.
- Capacity: Using the historic Throughput data, it forecasts the best-fit completion rates if a given number of additional cards are pulled onto the board
- Cycle Time: Represents the time a work item (Defect/feature) took to get completed, from the time it was prioritized and pushed to the board.
- Flow Efficiency: Measures the actual work time against the Lead time.
- Aging: Visualization of in-flow and out-flow of cards and their cumulative difference.
- Liquidity: Depicts capability of pulling work to the in-progress column of your Kanban board.
- CFD Forecast: Monte-Carlo simulation-based forecast distribution.
- Scope Forecast: Visualize the impact of your future delivery in terms of Lead Time and the Cost of Delay.
Other than the ESP analytics mentioned above, you can also take advantage of the following feature:
- Risk Module: A visual representation of the risks involved in an entity to help you take informed decisions to mitigate the known risks.
https://www.digite.com/swiftkanban/enterprise-services-planning-with-kanban/
http://www.djaa.com/introducing-enterprise-services-planning

