
*** This is an Add-On licensed feature. Please contact us at [email protected] to know how to avail it. In this article, we will help you understand how to predict completion dates for cards.
|
Skip Ahead to: How to Calculate the Forecast Date of a Newly Added Card |
Overview
It is business-critical to have a clear idea about when you are likely to complete a given piece of work before you commit a date for it. Sometimes, the date may be given to you and you are required to get back on whether it will happen or not. Similarly, you might be working on a card that is a dependent card for another card. So, any slippage on the current card might have far greater consequences downstream.
Kanban systems expose the low Flow Efficiency of the software development systems. In other words, work items often spend more time waiting than being worked on. This means that the estimated effort to complete a work item is not a strong determinant of when that work item will be completed. Instead, all the wastes and inefficiencies of the system contribute much more significantly when the work item actually gets completed.
SwiftKanban now gives teams the capability to see the most likely date of completion of any given work item (card). This is computed from the time when the card is added to the Board. SwiftKanban tracks Cycle Time (CT) for similar cards in the past and uses that to compute when you are likely going to complete a new card that has just started its execution on the Value Stream. However, because CT is a probability distribution (and not one absolute number), it lets you decide the percentage level of confidence that you want to associate with for predicting future cards. For example, for a Critical Customer Defect, you might want to see a % CT forecast that is based on a 95% level of confidence. In contrast, for a User Story with an Intangible Class of Service (CoS), you are adequate with a CT that has a 50% level of confidence.
How to Calculate the Forecast Date of a Newly Added Card
SwiftKanban offers you two distinct ways of calculating the forecast date of a newly added card.
- Basic Calculation method: This lets you derive the forecast completion date of a newly added card based on the card type and the confidence percentage you specify.
- Advanced Calculation method: This lets you derive the forecast date based on a criteria, which is more relevant for you. You could choose a combination of different attributes. For example, you can choose criteria that combine Card Type with Class of Service. You can add a Custom Attribute to that combination. Once you define such criteria, you can view the cycle time distribution based on those criteria, specify your confidence percentage, and apply that criteria to future cards that match that criteria.
Acquiring a License for the Forecast Date
The Forecast Date feature is only available with SwiftKanban Enterprise License. If you are a SwiftKanban Team or Group License subscriber and would like to use the Forecast Date feature, you will need to upgrade to the SwiftKanban Enterprise License. For more information on the pricing, please refer to this page. To avail of the Enterprise License, please contact us at [email protected].
Methods for Predicting the Completion Date of a Card
The percentage value is calculated based on the following methods:
Basic Cycle Time Forecasting Method
In this method, the system calculates the Cycle Time distribution of Done or Archived cards, for each card type. It identifies the percentage confidence value from the Cycle Time distribution, say 80%, and uses that value to compute the Forecast Date of completion of a new card.
For example, if you have 60 User Story cards and 90 Defect cards that are either archived or moved to or beyond the Done column, then the Forecasting method will calculate the 80% value of Cycle Time distribution of each of those Card Types, independently. This value will then be used to compute the Forecast Date for any new Defect or User Story card on the Kanban Board.
Note 1: For Basic Cycle Time Forecasting calculation, SwiftKanban does not predict an Expected Date of Completion if there are less than 50 cards of a particular card type that have been Archived or Done.
Note 2: The default confidence percentage considered by the system is 50%, but you can change it to any percentage as per your system characteristics.
A few important things to remember:
- While calculating the cycle time, the system takes into account all the cards ranging between the start and end column across multiple lanes in your Board that might have:
- Entered, exited, or moved beyond (to the right) the Done Column Type
- Archived in between the start and end column
- The Basic calculation method does not support cycle time forecast based on card attributes. If you want to define the cycle time forecast based on specific card attributes, use the advanced cycle time forecasting method.
Enabling the Forecast Date Field for the Basic Forecasting Method
You must have the Admin or Manager access to enable this Forecast Date field via the Board Editor.
To enable this field, perform the following steps:
- click the Board Settings
 icon on the top menu bar.

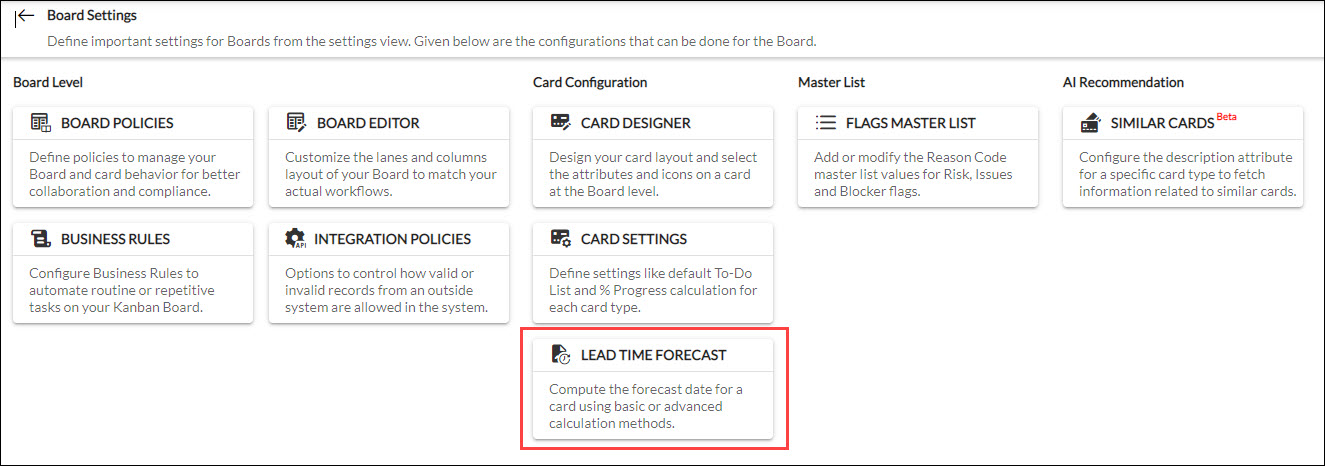
- On the Board Settings page, click the Lead Time Forecast tile.
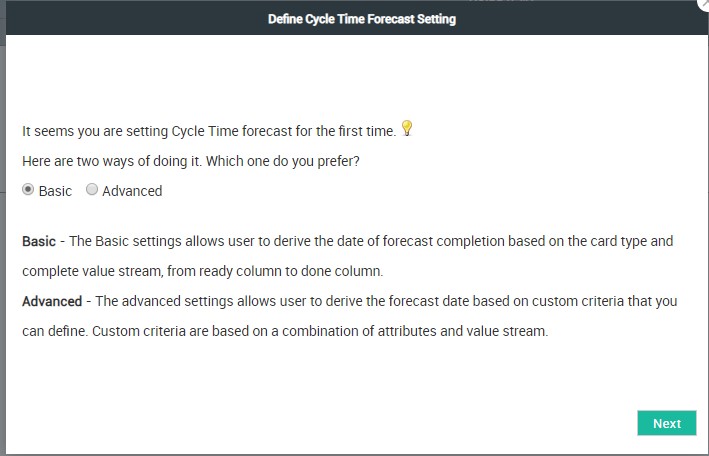
- On the Define Cycle Time Forecast Setting wizard, select Basic to calculate the Forecast. Click Next.
- Find which card types are eligible for this Forecast Setting. Click Next.
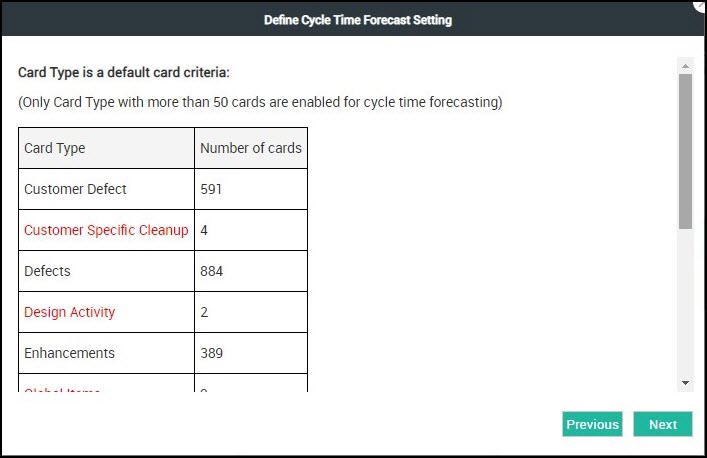
Note: Any card type having 50 or more cards previously archived or moved to or beyond the Done column will be considered for this Forecast calculation.
- In the Define Cycle Time Forecast Setting wizard, enter the Confidence % value for cycle time forecasting. By default, the percentage will be 80.
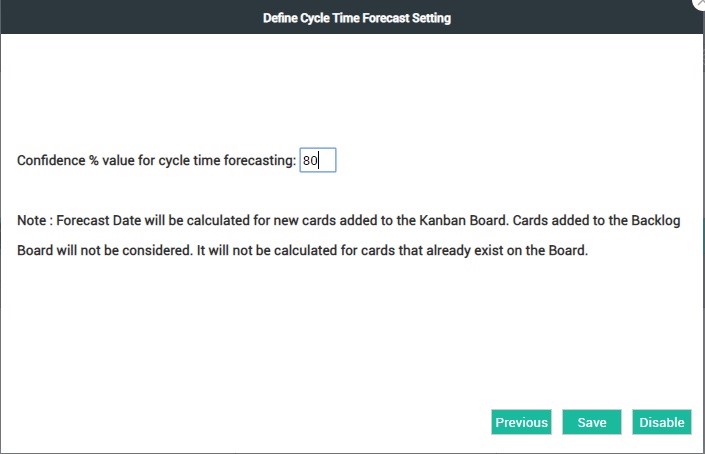
- To save the setting and activate it for the Board, click Save and then Enable on the page.
Note: The Forecast field will be displayed only for the cards that are added to the Board after this setting is enabled. - Go to the Board for which you have enabled this setting, and add a card of the card type that is eligible for the Forecast setting.
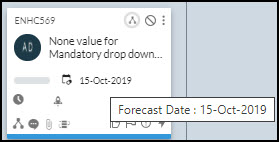
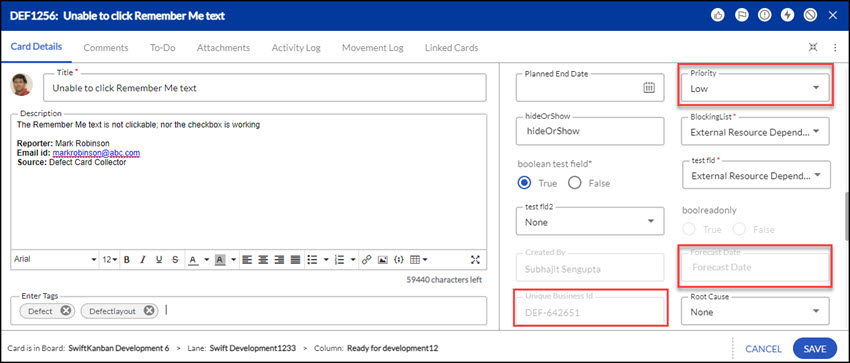
- View the Forecast Date on the Card layout view or Edit view.
- Card Edit view
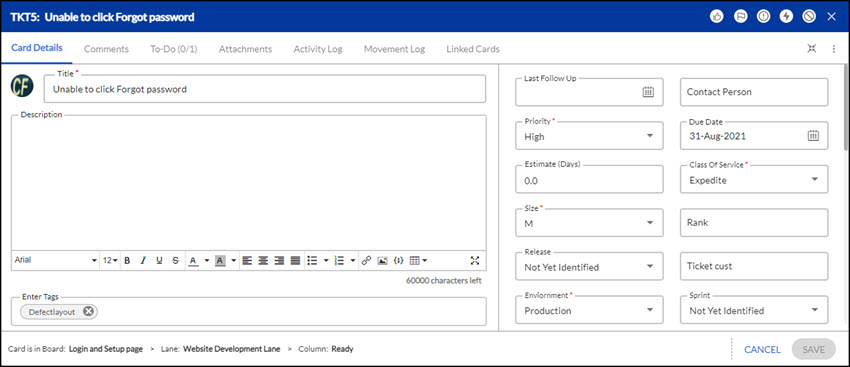
Note: To view the Forecast Date in the card Pop-up view, make sure to enable that field in the Card Designer.
Advanced Cycle Time Forecasting Method
In this method, SwiftKanban lets you define custom criteria based on a combination of card attributes (like Card Type, Category, Class of Service, and others) and value streams. Unlike the Basic method, you can go granular in the Advanced method and create criteria based on the combination of different row and column values as shown in a Pivot table. You can have multiple combinations of card attributes in one criterion and can also create multiple of them.
Let us understand this method with an example. We have a Kanban Board where we manage and track cards like User Stories, Defects, Customer Defects, and others. This Board has multiple value streams or swim lanes. We would like to know, given the 80% confidence rate, how long a Defect or Customer Defect card with Critical and High priority will take to complete whenever they are added to the Product A Kanban Board swim lane.
So, first of all, we begin with enabling the Forecast Date feature by navigating to the Board Settings > Lead Time Forecast.
Note: One must have Admin or Manager access on the Board to view the Board Settings icon and navigate to the Board Settings page.
To enable the Forecast Date feature, click the Lead Time Forecast tile. It displays the Define Cycle Time Forecast Setting wizard.
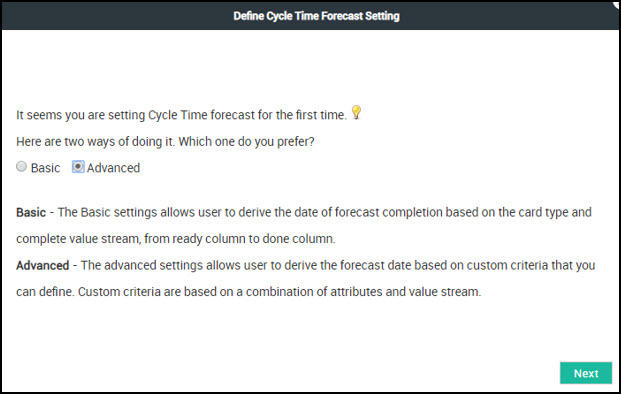
On this page, we need to select the method for calculating the Forecast Date. In our case, it is the Advanced method as we need to apply the forecast on two card types (Defect and Customer Defect) based on two attribute values (Critical and High Priority) for a particular swim lane (Product A Kanban Board).
We select the Advanced option and click Next. It shows the pivot table that helps us to define the criteria based on card types and their attributes. We need to drag the card attributes (like Card Type, Priority, Category, and so on) either to the row or column of the pivot table according to our requirement and render the table. The system will automatically compute the number of cards that fit that combination of attributes. In our case, we will drag the Card Type to the row level and Priority to the column level as we want to view specifically the Priority-wise count of Defect and Customer Defect cards. The pivot table shows the individual count of all the card types based on their priority.
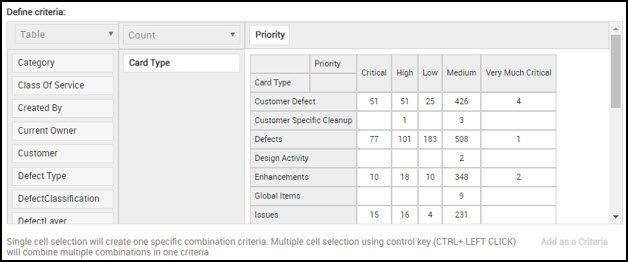
So, as per the data shown in the pivot table, we have:
- 51 Critical and 51 High Priority Customer Defect Cards that have been either archived or moved to the Done column type.
- 77 Critical and 101 High Priority Defect cards that have been either archived or moved to the Done column type.
Our Forecast Date calculation will be based on the above cards, so we need to select the cell values corresponding to the combinations (Comb 1: Customer Defect + Critical, Comb 2: Customer Defect + High, Comb 3: Defect + Critical, Comb 4: Defect + High) and set it as a Criteria for the forecast calculation.
Note: Although you can select any count as a basis for calculation, we recommend that the cumulative count of all the selected data points needs to be at least 25 to compute the cycle time histogram.
To define the Criteria, we select the required cells by pressing the Ctrl (Windows) or Command (Mac) button and selecting the values simultaneously. In our example, we have selected values for Customer Defect and Defect with Critical and High Priority.
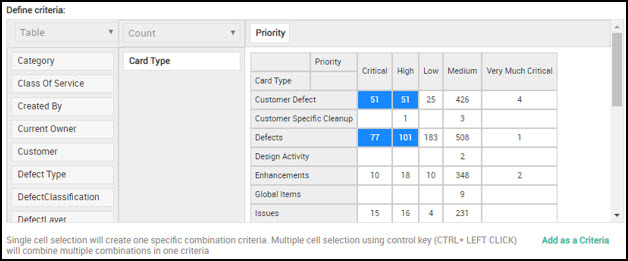
After selecting the data point or the cells with values, we click the Add as a Criteria button. It shows the added criteria with all the combinations.
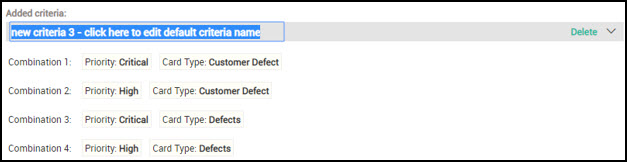
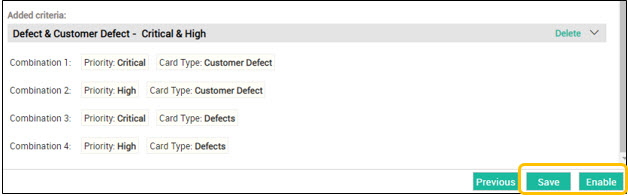
We can change the name of the criteria to something more meaningful like “Defect & Customer Defect – Critical & High” and click the Save and then the Enable buttons respectively to complete enabling the Forecast Setting process.
Similarly, we can define another criterion after selecting cells that add to 25 cards and then, give their name.
For example, we can set criteria for Task cards with High and Medium priority and get to know the forecast date of a newly added Task card. So, like the criteria with Defect and Customer Defect, we define another criterion by selecting the cell values matching our requirement and building the combination.
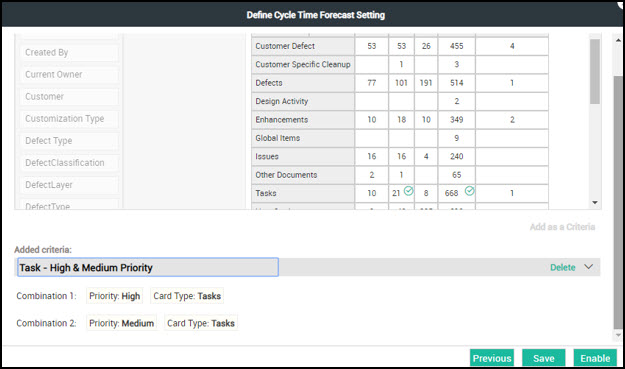
As shown in the above image, we have selected cell values for Tasks with High and medium priority, renamed the priority with a meaningful name, verified the combinations (Card Type: Task + Priority: High) and (Card Type: Task + Priority: Medium), and then saved and enabled the criteria. Now it is ready to be subscribed at the individual swim lane level.
Now, it’s time to subscribe to these criteria for the required swim lanes. In our case, we need to subscribe to the “Product A Kanban Board” swim lane.
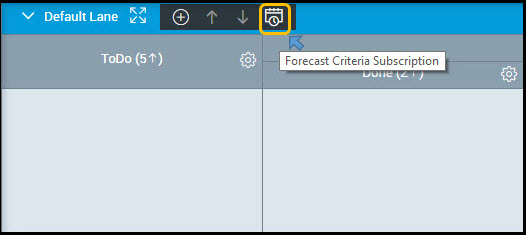
So, we click the Forecast Criteria Subscription icon (as shown in the above image). The Cycle Time Settings page for the swim lane is displayed.
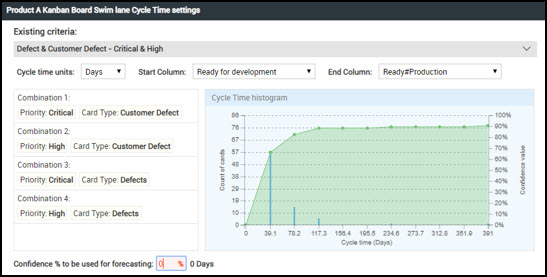
Here, we view the cycle time distribution of cards that match the combinations defined in the criteria in the form of a histogram. We can also apply other filter criteria like Cycle time Units and start and end columns to render the histogram as per our requirement.
Note: By default, the existing criteria will be collapsed. You need to click the side arrow button of the criteria to expand and view the histogram.
For criteria, we can set the Unit of Measurement either in Days, Weeks, or Months. The Cycle Time will be interpreted as per the unit selected here. We can also specify the Start and End Columns which are used as a range under which all the cards match the combinations (in our example, it is Customer Defect: Critical, Customer Defect: High, Defect: Critical, and Defect: High) are considered for the cycle time histogram.

In our example, we have considered Days as Cycle time units and set the start column as Development#Design and the end column as Ready#Ganesha because these two columns are the start and end of our non-ready columns. The actual work happens in between these columns that contribute to the cycle time calculation.
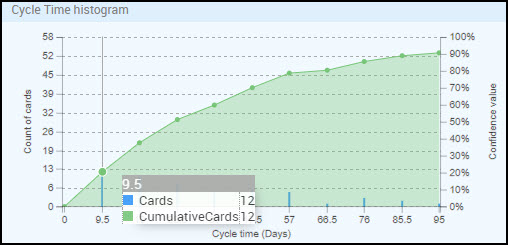
Now, let us understand the Cycle Time Histogram and how it predicts the forecast date based on the confidence percentage. It is a dual-axis chart where the Y-axis on the left shows a range of card count archived and Y axis on the right shows the range of confidence value. The X-axis shows the buckets of cycle time (how many cards are completed in what cycle time bucket).
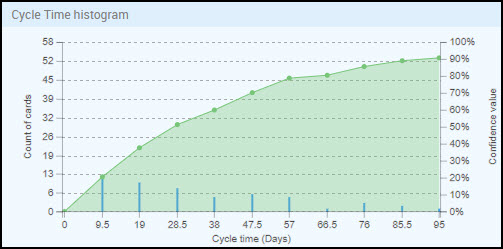
Each data point on the chart shows the number of cards having a certain cycle time. The line builds up by joining all the data points and accumulating all the cards that have been archived with various cycle time buckets.
For example, in the image below, hovering over the first data point from the left shows that 12 cards have an average cycle time of 9.5 days.
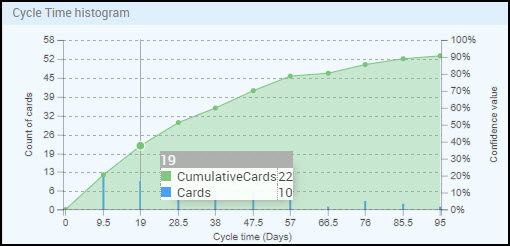
When we hover over the second data point (from the left), it shows that 10 cards have an average cycle time of 19 days and there are a total of 22 cards (12 cards from the previous data point + 10 cards from the current data point).
The forecasting calculation refers to this cycle time trend and considers the confidence percentage that we enter to predict the forecast days of a newly added card. In our example, when we enter 80% as confidence for forecasting, it predicts that a newly added card will take 48 days to complete, which means 80% of my Defect and Customer Defect cards with Critical and High priority in between that selected column range have taken almost 48 days to complete.
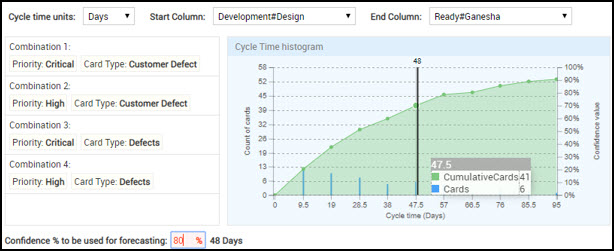
When we lower the confidence percentage, like 65%, the forecast days also change to fewer days. So, we can set this percentage as per our confidence on the past throughput and decide the ideal number of days required for a new card (in our example, Defect or Customer Defect) to complete when added in the subscribed swim lane (in our example, the Product A Kanban Board swim lane).
To set the confidence percentage and complete subscribing to the criteria for a swim lane, click the Save button.
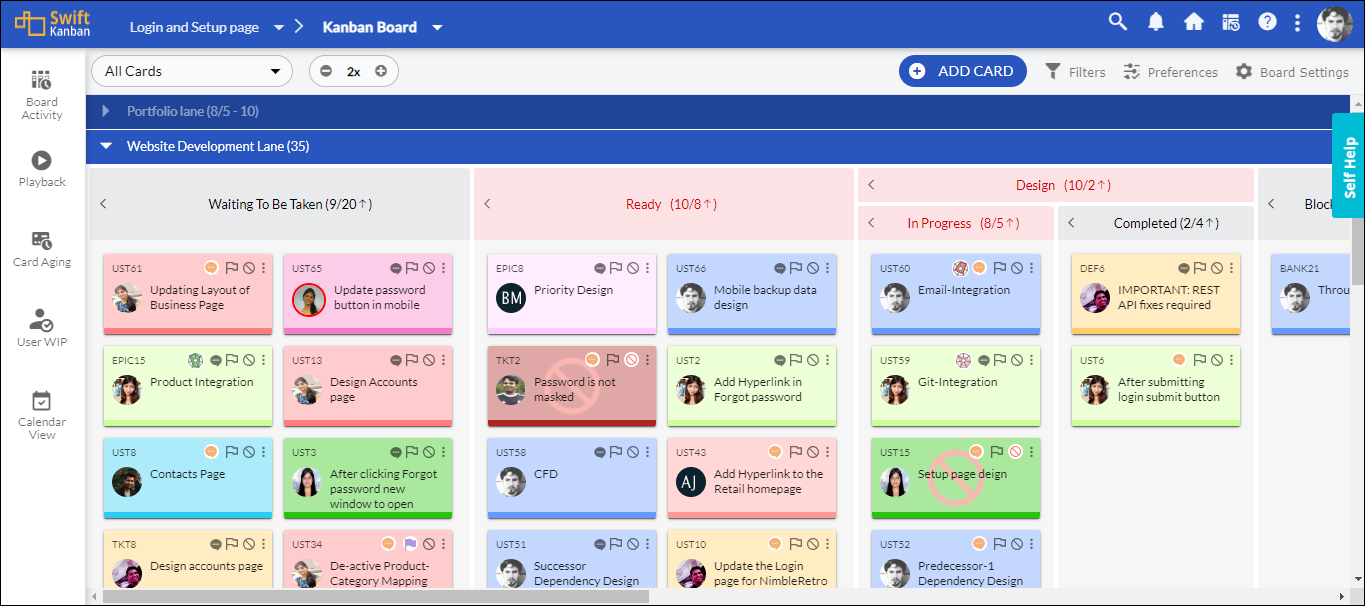
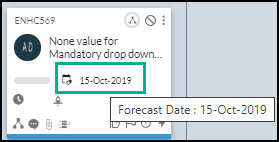
Now, when we go to the Kanban board, and add a Defect card with High priority on the Product A Kanban Board swim lane, it shows the Forecast Date as per the confidence percentage entered and days predicted accordingly in the Cycle Time setting page.
- Card layout view
- Card Edit view
Note: To view the Forecast Date in the card layout view, make sure to enable that field in the Card Designer.