In this article, we will help you to understand how to view a personas’ demand vs capacity.
|
Skip Ahead to: |
Overview
The Demand vs Capacity page displays demand (open requests) and capacity of personas across all the projects in the organization. This provides you with clear visibility into the persona’s demand, available capacity, and net capacity on a weekly or monthly basis and gives you greater confidence when hiring decisions need to be made.
The shortage of personas will persist if there are more requests for the personas than that persona’s available capacity. For example, suppose the team leader persona has a demand for 10 users(resources) and an available capacity of 5. Similarly, persona excesses occur when demand is less than the available capacity. For example, suppose the team leader persona has a demand for 5 users and an available capacity of 10. Net capacity is calculated by subtracting available capacity from demand, and it displays a positive value if demand is less than available capacity, and a negative value if demand is greater than available capacity, indicating that users should be hired to meet the demands.
Example
If you want to view the demand for a project manager persona with a Mumbai location and a duration of March to May 2022.
In the given image for the project manager persona, there is a total demand (team member request) of 5, an available capacity of 10, and a net capacity of 5, and PR1 SwiftKaban and PR2 SwiftEnterprise are the lists of projects that the project managers are working. The weekly/monthly view shows the available net capacity of the persona and the number of demands requested for each project week-wise or month-wise for a specified duration.
The Net capacity is calculated through the following formula:
Net Capacity = Available Capacity – Demand
After allocating the requested demand, the capacity that is currently available is shown as net capacity. Hiring decisions will be made based on the net capacity value.

Navigation
In the left navigation panel, expand the Apps menu and select the Account Space. Hover over the top breadcrumb, expand the People Management module, and select Demand VS Capacity.
UI Representation
- Demand vs Capacity Board: The Demand vs Capacity page displays demand (open requests) and capacity of personas as well as the projects from across the organization. It consists of Persona, Demand, Net Capacity, and Duration.
-
- Demand: It displays the total number of open and partial requests for each persona across the organization.
- Available capacity: It displays the persona’s available capacity across the organization.
- Net Capacity: It is calculated by subtracting available capacity from demand.
- Weekly/Monthly View: It helps you to see how each persona is utilized in a specific project over a specified time period. If the weeks or months are green, it indicates that users are available for that persona. Similarly, if the weeks/months are red, it indicates that users are not available for that persona and that you must hire for that persona.
-
- Toolbar: The Utilization View’s toolbar consists of three options- Clear All Filters, Filter, and View by option.
-
- The Clear all filters option is used to remove all the applied filters and see all the information without any filtering.
- The Filter option is used to filter out the information based on skills, persona, duration, and location.
- The View by option allows you to view user utilization in weeks or months.
-

Steps to View Persona’s Demand vs Capacity
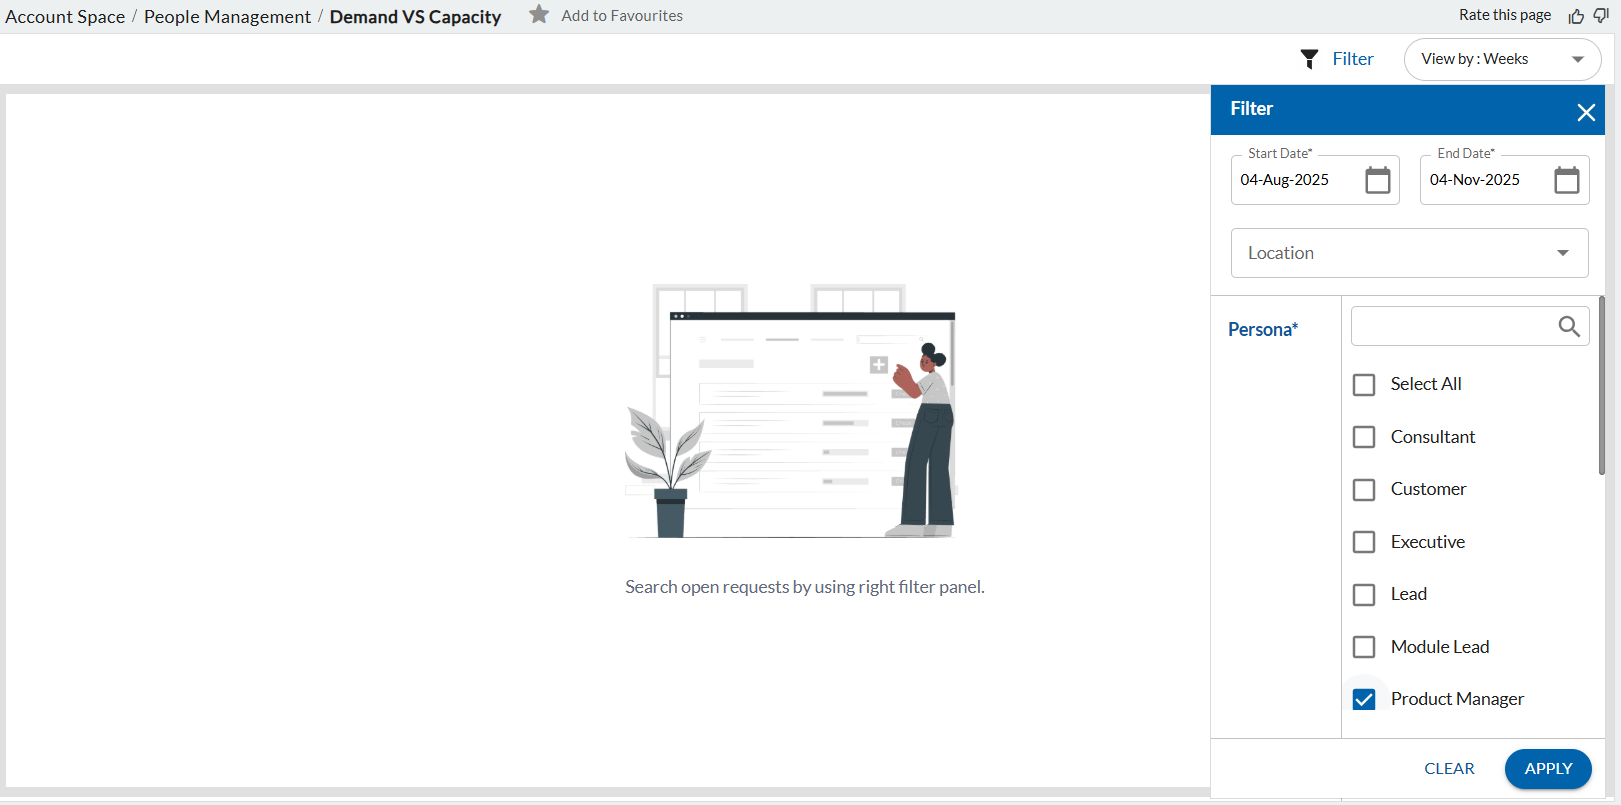
- Click the Filter icon on the top right corner.
- Enter the filter criteria as explained below:
-
- Start Date: The start date from which you want to see the Demand Vs capacity of the users. By default, the start date is taken as the current date.
- End Date: The end date till which you want to see the Demand Vs capacity of the users. By default, the current date is the date three months from the current date.
- Duration: Start and end dates of the persona
- Location: The location of the persona
- Persona: Select the type of persona using the drop-down
-
- Click the APPLY button. The persona demand vs capacity view for the selected personas will be displayed.
Note: The Utilization View screen will appear blank until you select the project, location, and other filter criteria.