
Start with the video first to get a better grasp of the topic!
|
Skip Ahead to: |
From the Analytics landing page, you can open the Analytics pages. Within each of these Analytics pages, widgets are added. This section covers the basic activities performed on widgets.
Performing Contextual Actions
The following contextual action is present upfront while all the others are available in the ‘More’ menu.
- Refresh
- Toggle Chart/Table
- Carousel View
|
Contextual Menu Icon |
Description |
|
|
|
Refreshing Widget |
Refreshes/ reloads the widget to reflect current data. |
|
|
Toggling Between Chart and Table |
View Chart or Table at a given time. |
|
|
Carousel View |
Switch to the carousel view of the widget. |
|
|
Back |
Takes back to the previous drill level after a drill-down is performed. |
|
|
Home |
Takes back to the home page of the widget if you have drilled-down multiple levels. |
|
|
Settings |
Data, Chart settings for the widget. |
|
|
Clear Sort |
The Clear Sort option allows you to remove sorting applied on any column in the Workitem Analysis widget and restore the default sequence. This helps maintain the intended order for time-series and predefined fields, even after sorting and refreshing the widget. The option also works across multi-level drill-downs, allowing you to reset the view at any point during analysis.
Note: This option is available only in the Workitem Analysis widget. |
|
|
Inverting Axis |
Inverts the X-axis to Y-axis. Note: This option is disabled for Agile Analytics (Sprint Velocity/ Burndown Chart) widgets. |
|
|
Legend Position: Customize the placement of the legend in Analytics widgets to improve readability and optimize space. The Legend Settings option allows you to position the legend (labels) on the right, at the bottom, or disable it entirely.
Edit Color: Allows you to select custom colors for specific values represented in the chart. Clicking Edit Color in legend settings opens a visual color palette to customize the appearance of values such as workflow stages, priorities, or any dimension represented.
|
|
|
|
Copy Widget |
Creates a copy of the widget on the same page. |
|
|
Move Widget |
Moves the widget across pages. |
|
|
Export |
It exports the widgets data into Excel, Word, or PDF format. |
|
|
Accessing Widget Help |
Opens the help page for the widget. |
|
|
Delete |
Deletes the widget. |
Drilling
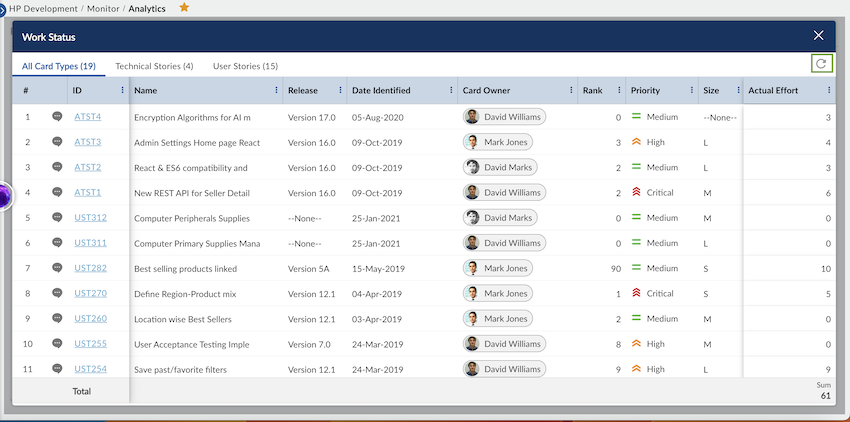
In widgets such as Item status, you can set the parameters such that it drills down the data accordingly. For example, you want to plot the tickets raised as per the version number. Then, you want to further drill down as per the ticket status (closed/ open). Finally, you want to further narrow down the ticket priority to Medium. You can drill down even further to get the exact ticket Ids.
Once you click on the data to drill it down, it shows the data in the list view. If there are multiple types of the workitem in the data, then a list view of all workitem types is generated similar to Work Hub listing along with the All Types list. You can modify any value (row-level editing) in the list view of a specific workitem type by directly clicking the value and entering the new value. Once you modify the values, click the Refresh icon to see the updated list of values.
Note: The row level editing is not allowed in the All Types list.
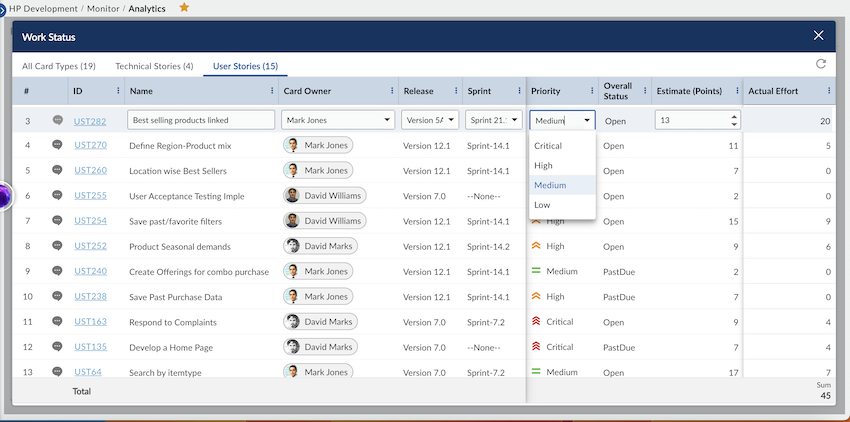
- The same drill-down level persisted across the sessions.
-
The label names orientation will be either horizontal or vertical, depending on available space, ensuring easier and more intuitive data interpretation.
When you drill down into analytics charts at the Organization level, you can view project details more easily.
- Project Name Column in Drill-Down Listings: A dedicated Project Name column is available when viewing listings that contain data across multiple projects. This allows you to quickly identify the associated project for each workitem.
- Project Name in Workitem Details: When opening a workitem from the drill-down listing page, the window heading now includes the Project Name, appended to the Workitem Name, ensuring complete project context.
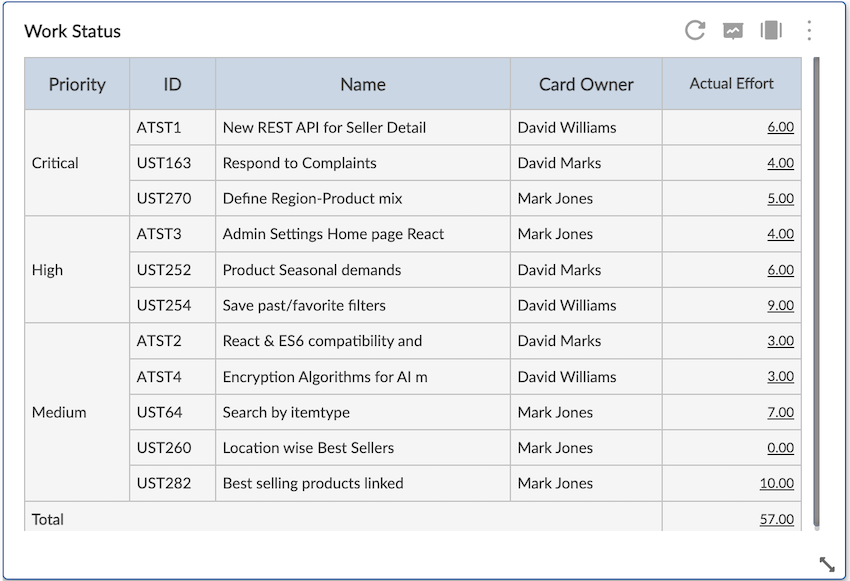
Pivoting
Similar to performing a drill down on a chart, you can further filter down the results pertaining to a detailed category in the table form. When the drill-down is done from a table format, it is termed pivoting. To pivot the required data, select the table/ chart toggle icon to switch to table format. Then click on the underlined data, to further drill down the information until you get a list of required items.