
This article will provide an overview of the Personal Analytics sections of the workspace.
|
Skip Ahead to: |
Overview
Analytics can provide important analysis related to your daily work that helps you monitor, identify problem areas, and get on track. Based on your work profile, you may want to track your activities. E.g. a tester would want to monitor Defect Leakage Analytics, a developer may want to keep track of the ‘Open’ Defects, and a Project Manager may want to track the project progress.
On the My Analytics page, you can plot the analytics that you want to monitor based on your role and access to data across projects.
Navigation
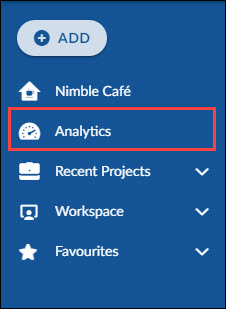
You can access your Personal Analytics directly from the Analytics on the Primary Navigation.
My Analytics
By default, the My Analytics page has three analytics: Personal Analytics, OKR Analytics, and People Utilization.
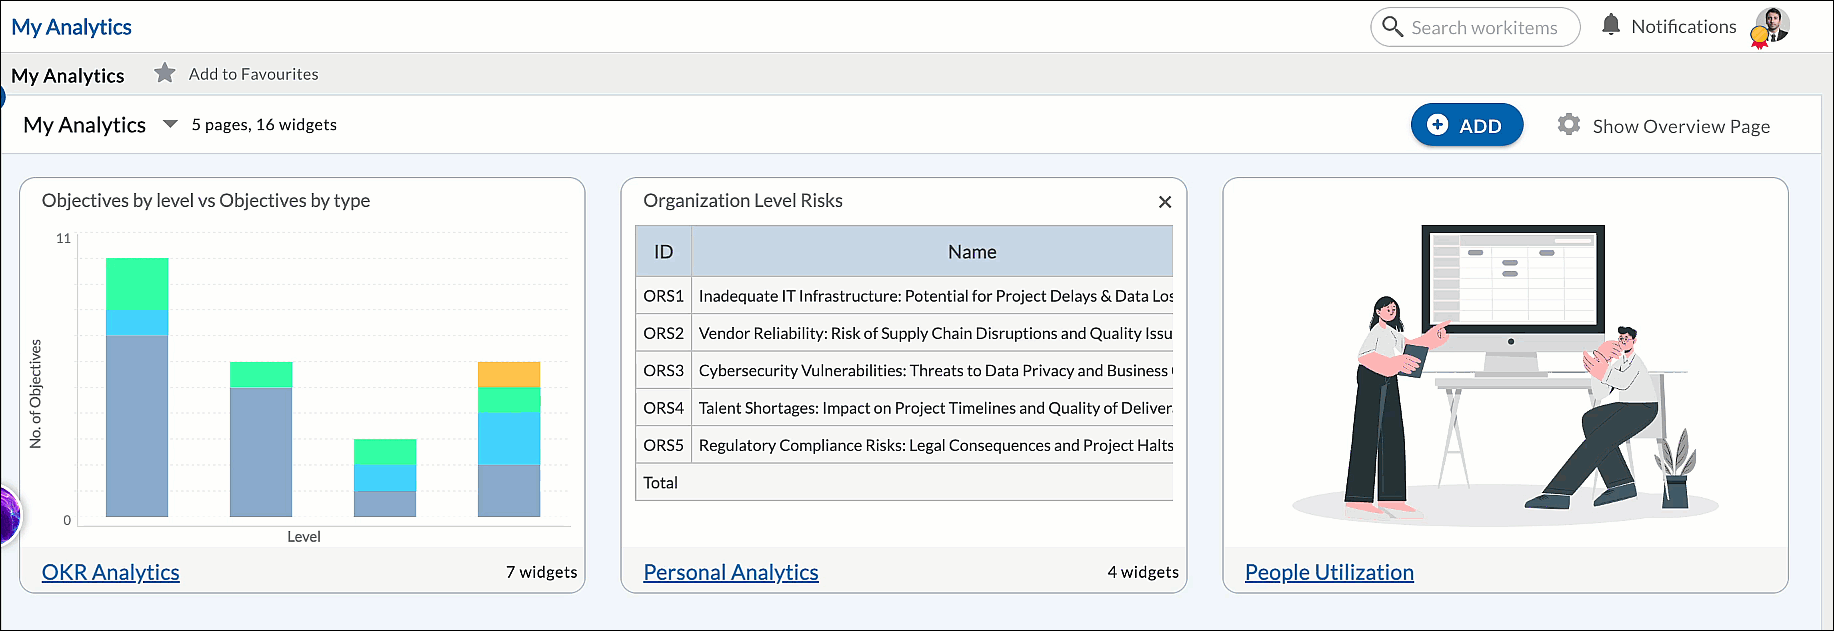
- When you navigate to the Personal Analytics page for the first time, a default page is available with the 2 default widgets—Open Cards by Card Types and All Cards on Board. You can also create and plot your widgets.
- If OKR is enabled in your enterprise, the OKR Analytics page will also have OKR widgets. To learn more about OKR Analytics, read here.
- Next, the People Utilization page is enabled only if you have access to the Utilization View under People Management. Note: The People Utilization page is a replica of the Utilization View. To learn more about People Utilization, read here.
Personal Analytics
You can create a new page by clicking the Add page icon on the top-right corner. To add your analytics, click the Add widget icon and select the required analytics from the Analytics Builder. Specify the required criteria on the setting page and your widget will be plotted. To know more about the chart types and analytics available on the Analytics Builder, read here.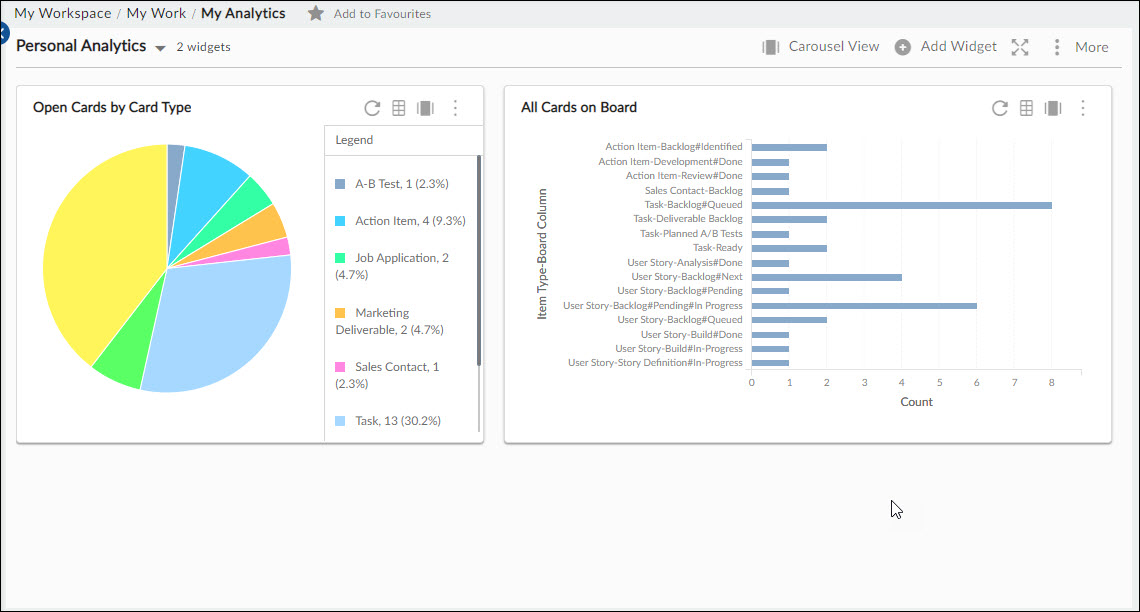
You can filter cards using the My Workitems and My Workitems on Board. The My Workitems filter helps you see all the cards assigned to you while the My Workitems on Board filter helps you know all the cards assigned to you and are available on the Work Hub.