
This article will help you to familiarize yourself with the overview, navigation, and different dashboards of OKR Analytics.
|
Skip Ahead to: |
Overview
OKR (Objectives and Key Results) helps you align your goals with your vision, measure your performance, and improve your results. The OKR Analytics helps you track and visualize your progress towards achieving your objectives and key results.
The OKR analytics dashboard can provide you with several benefits, such as:
- It can give you a clear overview of your goals and how far you are from reaching them. You can see the status of each objective and critical result, as well as the related metrics such as sub-tasks.
- It can help you monitor and evaluate your performance over time. You can see how your progress changes over different periods, identify trends and patterns, and spot potential problems or opportunities.
- It can help you generate reports and communicate your results to stakeholders. You can use charts, graphs, tables, or other formats to present your data clearly and concisely.
- It can help you create transparency and accountability within your team or organization. You can share your dashboard with others, so they can see your goals and progress, and collaborate with you to achieve them.
Navigation
You can access your OKR Analytics by clicking Analytics on the Primary Navigation and selecting OKR Analytics on this page.
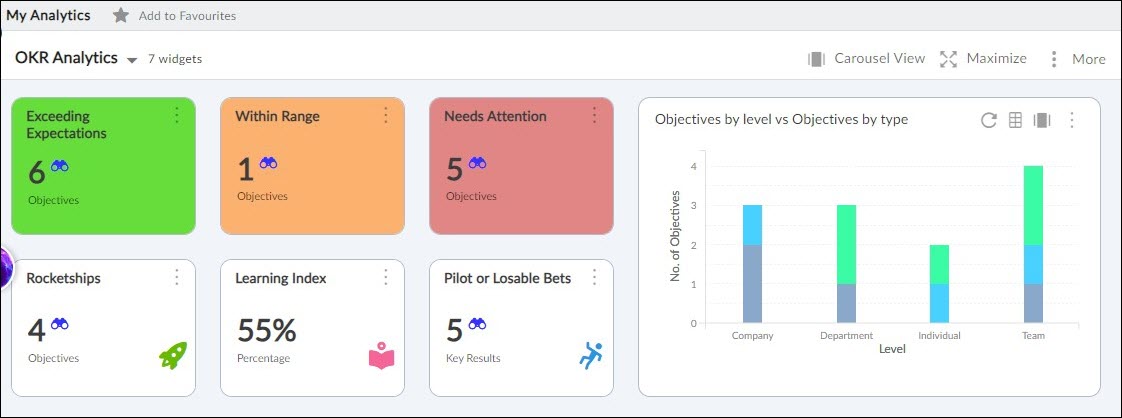
All Types of OKR Analytics
We have 6 tiles for OKR analytics. They are as follows:
Exceeding Expectation Tile
Green coloured (Tile label: “Exceeding Expectations”): If the Objective’s Progress >= TE.
TE = Time Elapsed
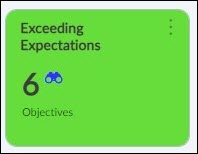
Within Range Tile
Orange coloured (Tile label: “Within Range”): If the (TE – Deviation)<=Objective’s Progress < TE
For example: TE = 50%, Progress = 48%, Deviation = 5%
(TE – Deviation) <= Objective’s Progress < TE
Progress = 48% is within the deviation range (i.e. 45% to 50%)
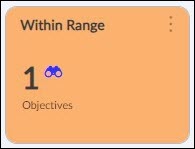
Needs Attention Tile
Red coloured (Tile label: “Needs Attention”): If the Objective’s Progress < (TE – Deviation)
For example: TE = 60%, Progress = 45%, Deviation Parameter = 8%
Objective’s Progress < (TE – Deviation) => 45% < (60% – 8%) => 45% < 52%
Progress = 45% is NOT within the deviation range (i.e. 52% to 60%)
“Deviation”: User input field [OPTIONAL; default = 5% ] in Objective’s Details segment called “Deviation”. Indicates how accommodating a user wants to be when comparing time elapsed for an objective with the progress for that objective.
Value for “Deviation” can be in the range of 5% to 100%
Rocketship Tile
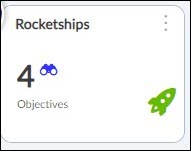
A Rocketship is an objective that is running ahead of its timelines. That means, if progress is twice the time elapsed beyond a time elapsed threshold of 20% for a purpose then it is a Rocketship.
For an objective to be classified as a Rocketship, it should satisfy both condition 1 and condition 2:
Condition 1: The time elapsed value for the objective is >= 20%
Condition 2: The progress value for the objective is twice (2x) of time elapsed value
With Rocketship a user can keep track of objectives that are performing far beyond expectations so that better decisions related to time allocation and check-in frequency can be made while setting future OKRs.
Learning Index Tile
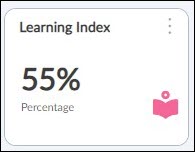
A user can give two inputs for any learning associated with a KR: 1. “Learning Impact” and 2. “Learning Description”, for each KR.
Based on this the user can look at the overall “Learning Index”, indicating how much learning is taking place within the team, department and company while the OKRs are progressing.
- “Learning Impact” (Mandatory; Default value = “No”); Dropdown for users to select from “No”, “Low”, “Medium” and “High”.
- “Learning Description” (Optional); Text box; Placeholder text = “Describe your learnings associated with this key result”
Computing Learning Index:
No. of KRs with Learning impact as “None” = N
No. of KRs with Learning impact as “Low” = L
No. of KRs with Learning impact as “Medium” = M
No. of KRs with Learning impact as “High” = H
Total no. of KRs = K
Learning Index = Round off to the nearest integer value ([(0*N + 1*L + 2*M + 3*H) / (3*K)] * 100)
“Round off to the nearest integer” means if the Learning Index comes out to be 66.66%, then show 67% or if the Learning Index comes out to be 33.33%, then show 33%.
For example,
No. of KRs with Learning impact as “None” = 2
No. of KRs with Learning impact as “Low” = 3
No. of KRs with Learning impact as “Medium” = 3
No. of KRs with Learning impact as “High” = 2
Total no. of KRs = 10
Learning Index = Round off to the nearest integer value ([(0*2 + 1*3 + 2*3 + 3*2) / (3*10)] * 100) = 50%
Pilot or Losable Bet Tile
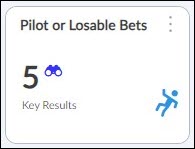
Denotes the number of KRs marked as “Pilot or Losable Bets”. A user can “tick” against the “Pilot or Losable Bet” option for a KR based on the amount of risk that the user associates with the KR.