
Start with the video first to get a better grasp of the topic!
|
Skip Ahead to: |
Overview
A Burndown Chart is a graphical representation of remaining work against time. It shows how much time or effort is left in a project versus the amount of incomplete work. You can track the progress of a Release or Sprint on a Burndown chart. Burndown charts can be tracked in Agile project. Moreover, you can also co-relate the burndown with the Scope Change feature in the Release or Sprint, which visually represents tagging or un-tagging of workitems from a release or sprint during its schedule. Also, the total workitem count line in the Burndown Chart gives you an insight of the total count of workitems tagged to a Release or Sprint during its schedule.
Note: The Burndown chart can be plotted on the following parameters:
- Hours
- Points
- Counts
Note: Count will not be available if you include the Workitem Count in the Display Analytics fields on the Settings page.
The Points or Counts parameters is plotted based on the Date Closed field of the workitems while the Hours is based on the time logged against the ToDos of the workitems.
Note 1: In case of counts or points, as the X- axis represents the release or sprint duration, only the workitem(s) having Date Closed within that duration are shown in the chart.
Note 2: In case of hours, as the X- axis represents the sprint duration, only the hours logged within that duration are shown in the chart.
Configuration
To plot a Burndown chart, perform the following steps:
1. Open Analytics Builder and go to Standard Widgets. Click the Burndown chart from the Agile Analytics group of metrics.
2. The Setting page appears where you can specify the settings for the widget:
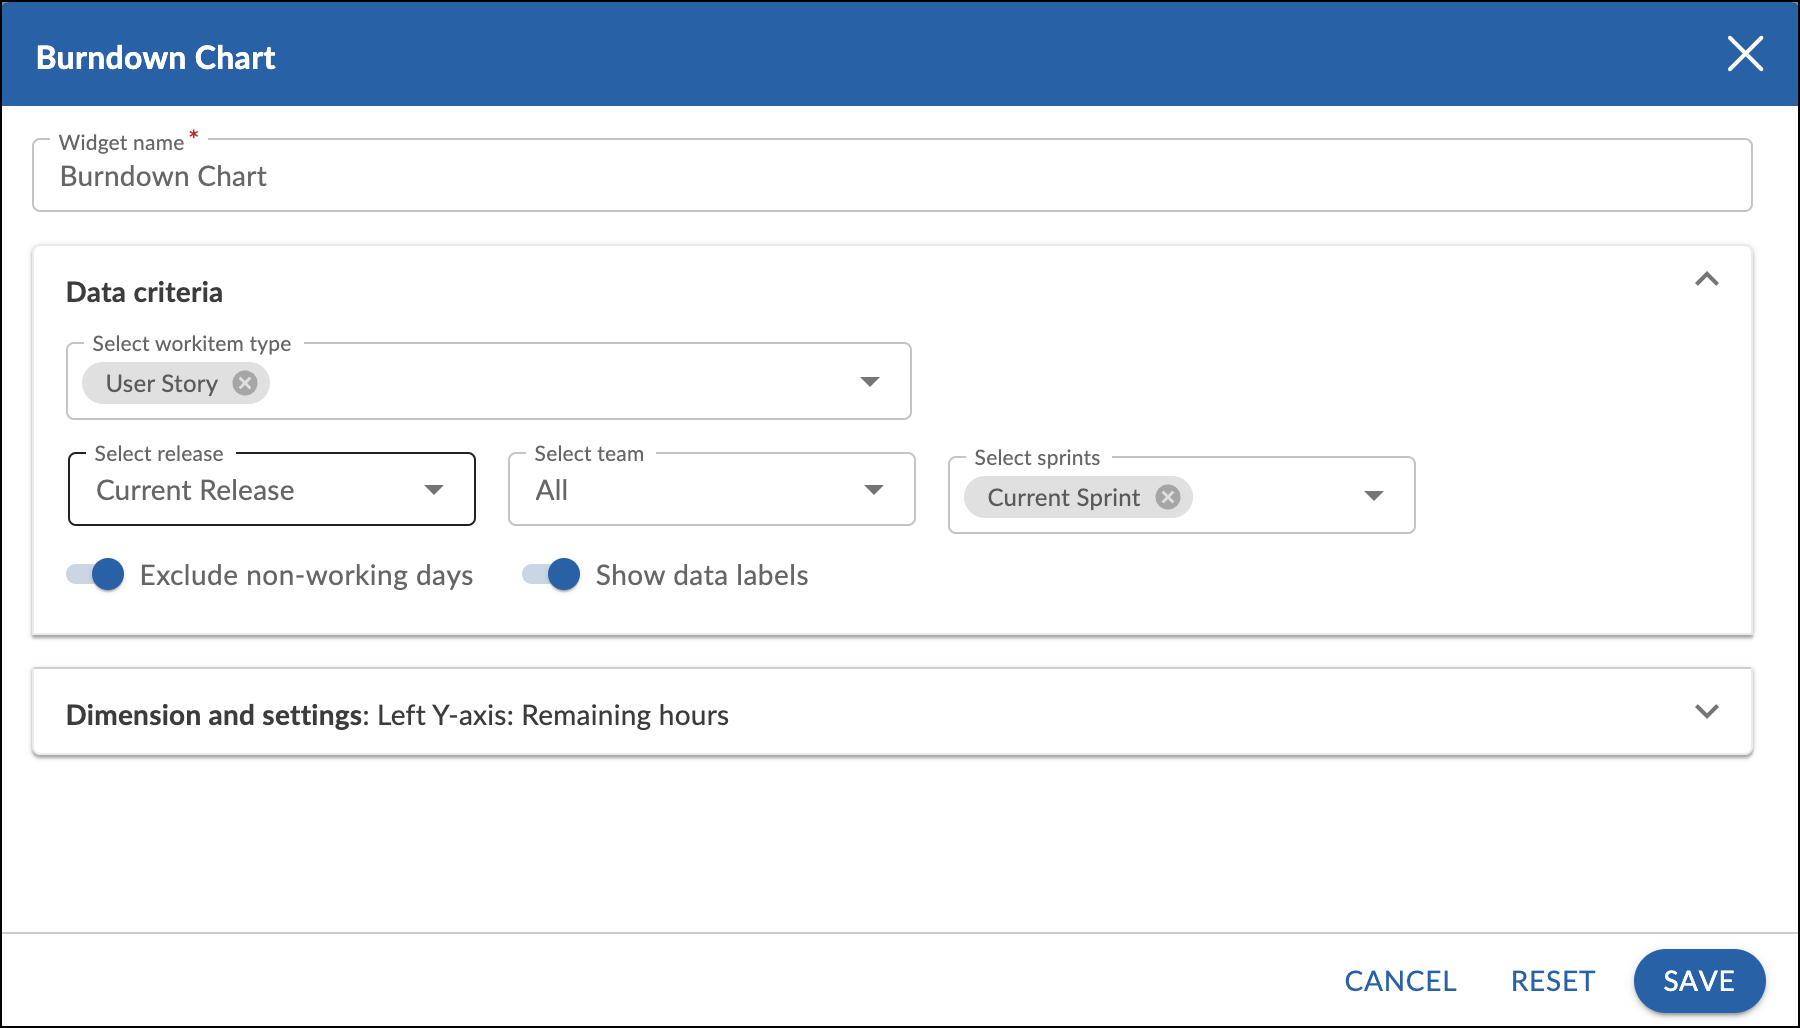
Widget name: Modify the name, if required.
Data Criteria
- Select workitem type: Selects the type of workitems from the drop-down that is to be displayed on the chart.
- Select release: Select the release for which you want to plot the widget.
- Select team: Selects the team name from the drop-down that is to be displayed on the chart.
- Select sprints: The sprints are listed as per the team, you have selected in the previous drop-down list. Select the sprint for which you want to plot the widget.
- Exclude non-working days: Select this option to ignore all the non-working days set using the project calendar. The summary will then be displayed and the Burndown chart will be generated based on the working days only.
Note: The first time you plot the Burndown chart, by default the Exclude Non-working Days option is selected. - Show data labels: Select this option to show the labels on the chart.
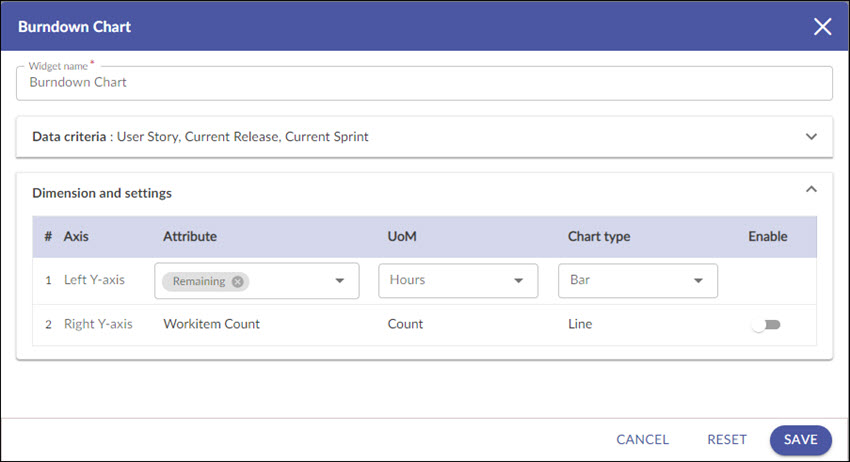
Dimension and settings
- Left Y-axis: Select the attributes, Unit of Measurement, and the chart type in which you want to plot data on the left Y-axis of the widget.
- Right Y-axis: By default, the attribute is set as workitem count, the Unit of Measurement is set as count and the chart type is set as Line chart for the right Y-axis of the widget. Turn the toggle on to enable the settings for the Right Y axis.
Interpretation
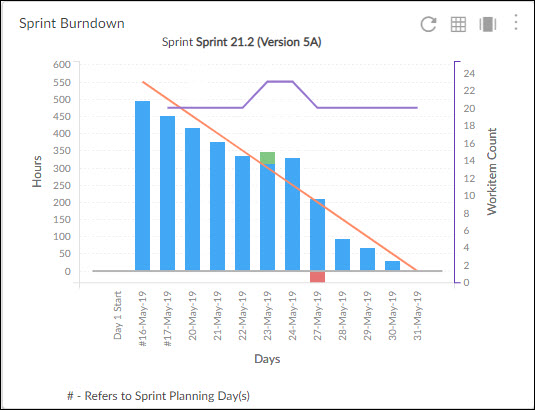
Burndown chart gives an overview of progress of work over time while completing a project. As work is completed, the graph “burns down” to zero
For each project, Y-axis displays the estimate statistics (Estimates (Points)/Workitem Count/Hours) and the X-axis displays the sprint/release duration. Each bar represents the amount of work remaining on each day of the sprint/release till the current day.
Day 1 Start – The date defined on this label over x-axis is the previous day of Sprint Start Date.
The Ideal Burndown depicts the rate at which the work needs to be completed in the ‘ideal’ scenario. It is a straight line that intercepts the Y-axis at the highest point showing the maximum work to be done. It gradually decreases to zero over the sprint/release and intercepts the x-axis. Also, to make it easier to understand how the Ideal Burndown starting data point is being derived, you click on it to view the list of workitems along with their Estimated Effort that are contributing to the Ideal Burndown starting point. It also mentions the date on which the workitems being tagged are getting considered for the Ideal Burndown.
Ideal Burndown Starting Data Point derivation:
-
When workitems are tagged to the sprint on Sprint Start Date, the Ideal Burndown data point starts from the Day 1 Start label on x-axis.
-
When workitems are tagged to the sprint on End of Sprint Planning date, the Ideal Burndown data point starts 1 day prior to End of Sprint Planning date.
-
When workitems are not tagged to sprint on Sprint Start Date or End of Sprint Planning date, then the Ideal Burndown point starts from the Day 1 Start label on x-axis.
Note: The workitems that are tagged at the end of this starting point will only be considered for Ideal Burndown. If no workitems are tagged to the sprint on the sprint start date or the end of Sprint Planning date set for the Sprint then on whichever next date workitems are tagged to the sprint, those workitems will be considered for the Ideal Burndown computation.
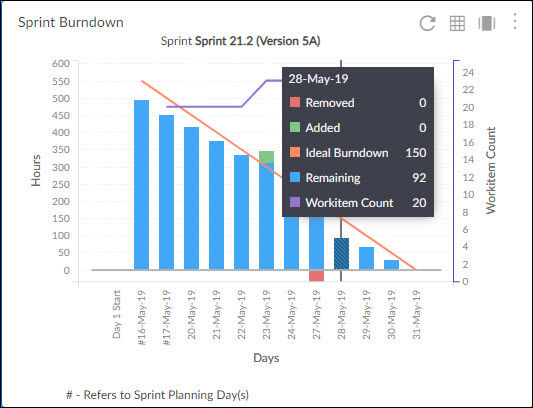
Hovering over any of the Ideal, Remaining or Actual data points, a vertical line intersecting all three will be displayed along with their values.
When you click any of the bars in the Bar chart, it generally displays the list of related workitems with their remaining effort. Clicking any workitem from that list shows the Workitem Details page. If you have also selected the Workitem Count from the Display Options field in the Settings, then the bar will also show you the Added or Removed effort in the bar respectively in green and red color. Clicking that color portion will show the related workitems added or removed with their effort being added or removed.
Scope Change in Burndown
Once the scope of work for the Release and sprint gets chalked out during the Release and sprint planning activity, the team works towards completing the committed items during the Release and sprint. However, there are times when the scope of work changes. The team then analyzes and decides to accept the change after weighing all factors. For this scope change event to be apparent while tracking Release and sprint progress, there is an option to view the Workitem Count on the secondary axis of the Burndown chart. This way, any spike or drop in the remaining effort can be easily correlated with the scope change.
The whole visualization of scope change offers a new dimension to your tracking progress of your Release and sprint. And if you would like to know later which items had contributed to the scope creep or were deprioritized from the Release and sprint, then you can get the details on drill-down easily.
In the Burndown chart, you can view the tagging or un-tagging of workitems from a Release and sprint on a particular day resulting into change in remaining hours via the color coded stacked Bar (in case you have rendered the analytics in Bar chart). The data for Workitems is displayed from the End of Sprint Planning date. Any addition in the hours or count after the End of Sprint Planning by tagging a workitem to the Release and Sprint on a particular day is shown in green color, whereas any deletion of hours or count by un-tagging a workitem from the Release and sprint is shown in red color as shown in the screenshot below.
In case you have rendered the Sprint Burndown of a Release in Line chart, the Remaining line in blue color will have incline or decline based on the above condition.
Note: The Scope Change can be viewed at Release or Sprint level. In case you select both Release and sprint in the Settings, then the Scope Change will be shown for that selected sprint. But if you select value for the Release field only and set the Sprint field as None (or de-select Current Sprint option for the Dynamic Release & Sprint settings), then the Scope Change will be displayed at the release level by aggregating all the sprints under it.
It is important to correlate scope change with End of Sprint Planning date. The End of Sprint Planning is a date from which scope of a Sprint has been frozen and any further changes to the sprint scope after that date are treated as scope change. The End of Sprint Planning date is entered in a Sprint eForm and the same is reflected in the Burndown chart.
Let us understand it with an example. As shown in the following screenshot, the End of Planning date for sprint SP 5.2.1 of release 5.2 is set as 07-Mar-19, and it is displayed with a # as its prefix on the X-axis of the chart.
Hovering over any of the Remaining, Ideal, Actual, or Workitem Count, a vertical line intersecting all four is displayed along with their values.
As displayed in the above screenshot, the Ideal Burndown hours are 453.53, Remaining hours are 426 and Actual hours spent is 33 and total workitems tagged to the sprint are 47 on End of Sprint Planning date. The remaining hours burndown on daily basis depending on the hours utilised for completing the Workitems.
On 18-Mar-19, the count of Workitems increased from 47 to 55 by tagging 8 more Workitems to the scope of the current sprint. The increase in workitems is represented by the purple line and simultaneously we can see an incline in the Remaining hours from 300 to 358.4 hrs that is represented by the blue line.
Similarly, on 25-Mar-19, around 3 workitems are un-tagged and the count reduces from 55 to 52. Simultaneously, we can see a decline in the Remaining hours.
Summary
- Sprint: Shows the name of the sprint appended by the release name on which the burndown has been plotted.
- Release: Shows the name of the release on which the burndown has been plotted.
Note: It is shown only when the sprint value is set as None in the Sprint dropdown. - Remaining: Shows the remaining Hour/Points/Counts as per the current day [If projected spillover is zero]
- Projected Spillover: Amount of work that will be spilled over in the release/sprint based on your current burndown.
- Improve burndown by x% to avoid spillover: Prescribes by what % you need to burn the remaining effort faster to ensure zero spill over.
The Projected Spillover and x% is calculated in the following ways:
-
Projected Spillover = Current Remaining Effort – (Current Burndown X Remaining Days of the Sprint)
-
x%= (Required Burndown – Current Burndown) X100 / Current Burndown
where,
Current Burndown = (Estimated Effort of ToDos – Current Remaining Effort)/Number of Sprint Days Elapsed
Required Burndown = Current Remaining Effort / Remaining Calendar Days of the Sprint
Note:
-
If x% =>5%, then only the Projected Spillover and Improve burndown by x% to avoid spillover summaries will be shown and the Remaining will not be shown.
-
If x% <5%, then only Remaining will be shown, and Projected Spillover and Improve burndown by x% to avoid spillover summaries will not be shown.
-
All the summaries are calculated on daily basis.
Best Use
If the remaining work line is above the Ideal line, it means that there is more work left than the predicted work and the Sprint or release is running behind the schedule. Similarly, if the remaining work is below than ideal burndown line then there is less work left and the project is running ahead of the schedule.
If your team is off of your schedule, you need to go back and look at the accuracy of your estimates compared to the time to complete them.