
In this article, we’ll guide you to view the Gantt chart.
Overview
View the task progress in the Gantt Bar Chart corresponding to the Tasks List View for tasks in the Task Plan form. The Gantt Chart can be viewed on a scale of Quarterly, Monthly, or Yearly periods by right-clicking the Taskbar.
You can also specify if you require today’s data or use Toggle Gridlines by right-clicking the Taskbar of the Gantt chart.
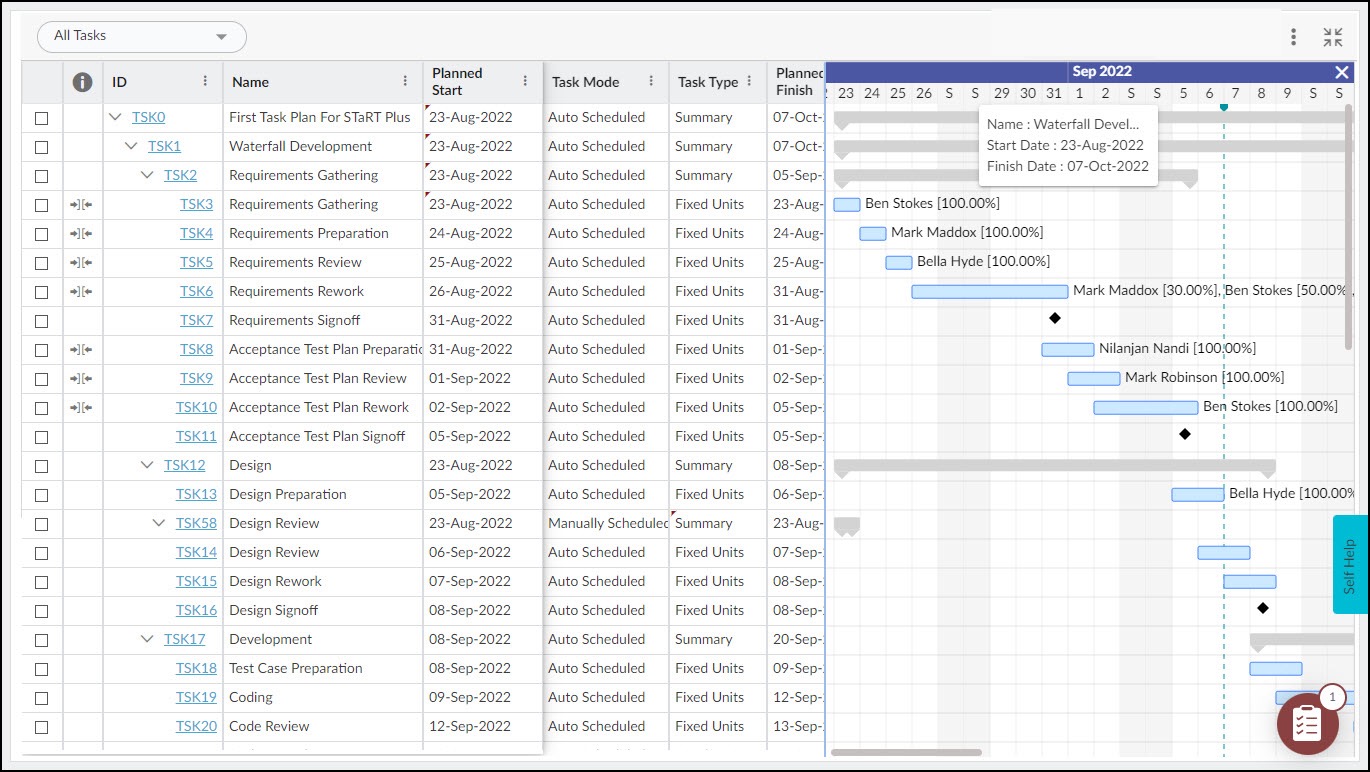
The chart displays the progress bars that can be scrolled through by dragging the canvas left or right. Hover on the bars to view information for the task. The summary task is indicated in black color.
The Gantt chart displays team members allocated along with the allocation percentage. You can turn on the Legends option under the More Options icon to understand the visuals on the Gantt chart like the Dependency arrow link, Black diamond, etc.
Note: The Gantt Chart is not available for the filtered task plan.
You can set dependencies between two tasks by dragging the connecting arrow indicator from the completion point of the first taskbar to the starting point of the second taskbar.
When the task dependencies are set and the network is established, the chart displays the linked tasks, hovering on which it displays the predecessors and lag time.
Operations to perform on the Gantt Chart
- Select from Monthly, Quarterly, and Yearly views for displaying the Gantt data by right-clicking the taskbar in Gantt.
- Similarly, right-click the Gantt’s taskbar to select today’s data on Gantt, or select from Vertical or Horizontal line portrayal.
- Hide the Gantt view and display only the Grid layout, and unhide the Gantt view through the toggle button.
- Task linking and Finish-Start dependency can be set by dragging the Gantt taskbar in the chart itself. It is possible to change the task dates by dragging the Gantt taskbars too.
- Mouse hover on the taskbar displays the task name, Planned Start, and End date as tooltip text. Double-click on the taskbar to view the corresponding task details popup.