
Start with the video first to get a better grasp of the topic!
|
Skip Ahead to: |
Overview
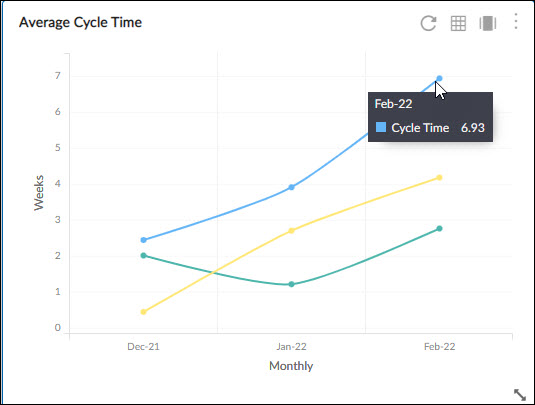
Cycle Time generally, represents the time a bug/feature took to get completed, from the time it was prioritized and pushed to the board. Lead and Cycle Time charts present the average amount of time it takes for a task to be processed from the specified start to the finish point. These can be used to analyze the time required to traverse work items and to make improvements in the project performance. Project managers should keep Lead and Cycle times as low as possible as it represents sunk investment costs with no business benefits.
The cycle time is what the team can influence by changing its work process. It is a mechanical measure for process capability. To reduce lead times, the cycle time can be (and should be) reduced.
You can view Cycle Time for cards passed through specific columns/stages as an Overall Average.
Cycle Time for a card
Cycle Time for a card is recorded for every column, such as the days or hours a card was lying in a particular column – from the Start Date when the card entered a column and when it exited the column.
Note: The time the card lies in a column is calculated as Exit Date- Entry date. It calculates 1 day as 24 hrs from entry time into a column.
The cycle time summed up for all columns the card was lying, is the Total Cycle Time for a card. You can select the filter options to generate a Cycle Time chart for specific lanes, date range, and other criteria.
Configuring the Chart
These are the common filter criteria that you can find in any of the Cycle Time widgets (Cycle Time Distribution, and Cycle Time Control). Other than those common criteria, there can be widget-specific filter criteria like the Metric field for the Cycle Time Control analytics. So, we suggest you read the Help information for each of these widgets carefully.
To configure an Average Cycle Time chart, perform the following steps –
1. Click the Add Widget icon on the Analytics page. The Analytics Builder appears.
2. Click the SKIP button at the bottom right of the Analytics Builder to see the Standard Widgets screen.
3. From the Lean Analytics section, click the Average Cycle Time chart. The Settings page of the CFD chart appears.
To plot the average cycle time widget, specify the following information:
Data Criteria
-
Workitem type: Select the values based on your requirement.
-
Start Date and End Date: Select both these dates from the calendar to limit the scope of data.
-
Select Filter: Select or create a filter to apply on the specified data.
-
Lane: Select the lane from the list box for which you want to plot the chart.
-
From andTo Column: Select the exact stages for which you want to generate by defining the Start Column and End Column.
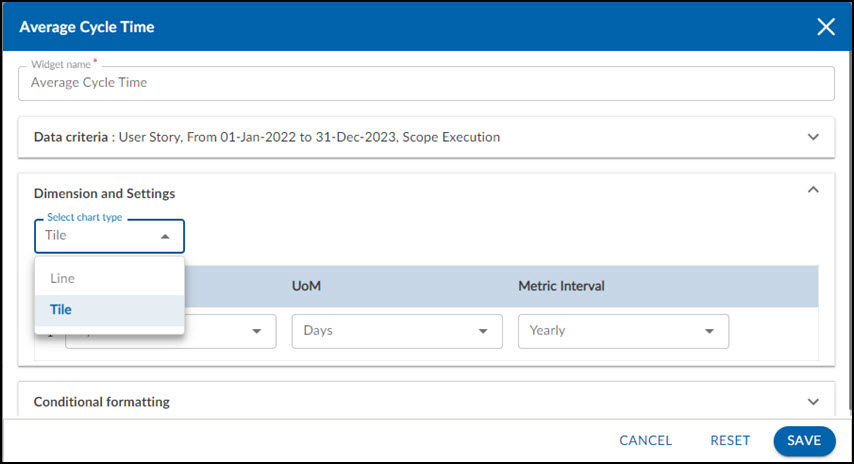
Dimensions and Settings
-
Select chart type: Select the chart type (Line chart or Tile) which you want to plot for the Average cycle time. If you select the Tile, you can apply the conditional formatting to your tile to plot the colors as per the number on the tile.
- X-Axis (Cycle Time): Snapshot of time (Daily, Weekly, Monthly, and Quarterly) for Analytics to be rolled up or unrolled on the X-axis of the chart.
-
Y-Axis (Date Range): Select the unit of measurement (Hours/Days/Weeks) for Cycle Time to be scaled on the Y-axis in the chart.
Note: If you select the Time Period as Weekly, then please remember that the week is considered from Sunday to Saturday.
Note: The charts consider the cards that have exited the End Column in the date range and also cards that may have skipped the Start Column through the End Column. The cycle time is from the time the card entered any lane in between the Start Column and the End Column to the time it was moved out of the End Column, or being archived in between Start and End column or moved to or beyond Done column type in between Start and End column.
If the End column is tagged as Done column type, then the cycle time is calculated till the card’s entry into the End column, not based on its exit from the end column.
If you select all or multiple lanes for plotting the chart, then the cycle time is calculated based on the archived cards and any cards that enter into the Done column type or move beyond Done column type.