
Start with the video first to get a better grasp of the topic!
|
Skip Ahead to: |
Overview
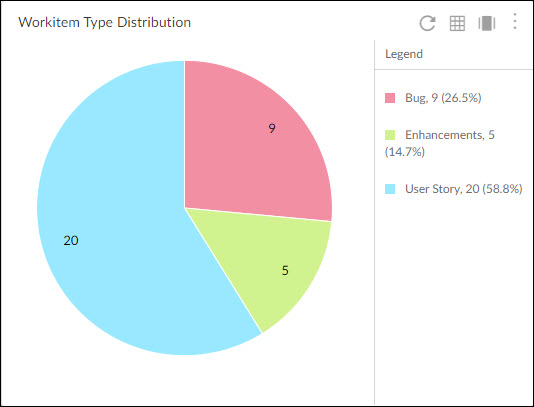
You can view the distribution of workitems based on their type for a given Sprint or Release. The distribution is based on the workitem count or point and is shown in the form of a pie chart. It helps to know the percentage of work is being taken up across multiple item types.
Configuration
To plot a Workitem Type Distribution chart, perform the following steps:
1. Open Analytics Builder and go to Standard Widgets. Click the Workitem Type Distribution from the Agile Analytics group of metrics.
2. The Setting page appears where you can specify the settings for the widget:
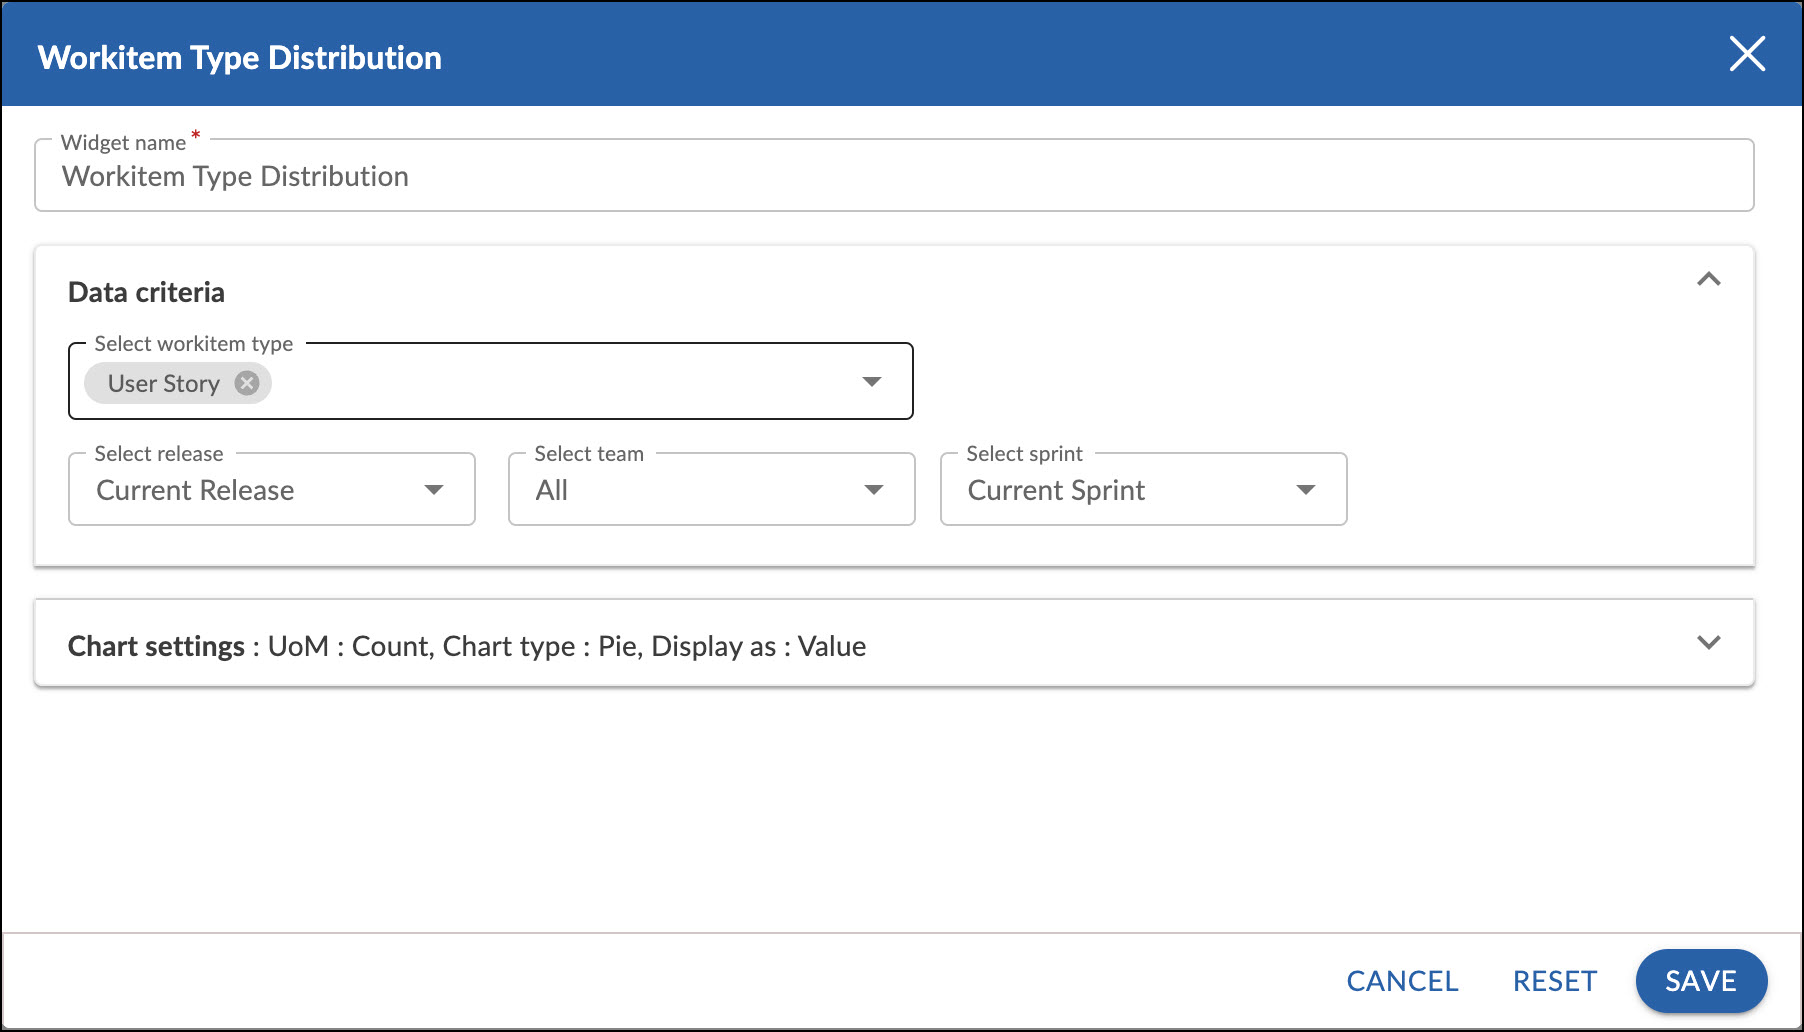
Widget name: Modify the name, if required.
Data Criteria
- Select workitem type: Selects the type of workitems from the drop-down that is to be displayed on the chart.
- Select release: Select the release for which you want to plot the widget.
- Select team: Select a team to see the sprints associated with the selected team only.
- Select sprint: Select the sprint for which you want to plot the widget.
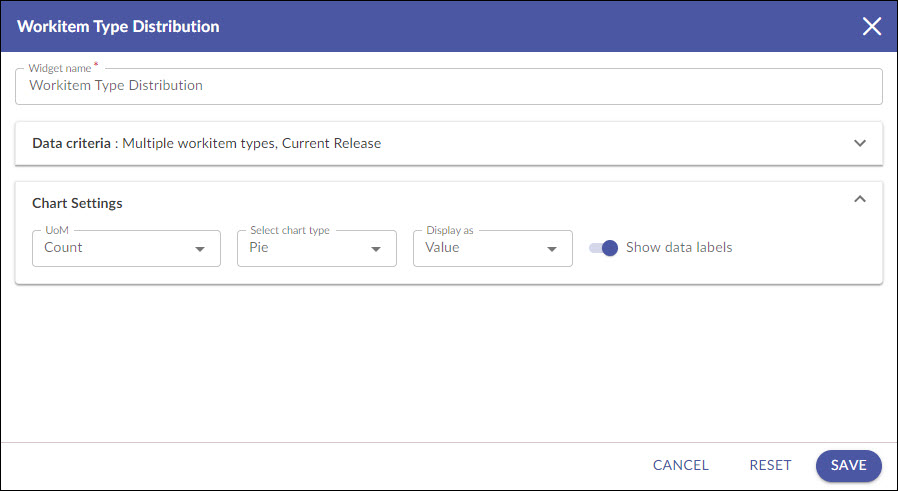
Chart settings
- UoM: Select the unit of measurement as points or workitem count for the releases to be plotted.
- Chart type: Select the chart type as pie or donut chart to plot the widget.
- Display as: Select whether you need to see the value or percentile or both for the slices. Note: By default it is value.
- Show data labels: Select this option to show the labels on the chart.
Interpretation
Each slice of the workitem type is shown in the color as set in the Forms screen and accordingly reflected in the Work Hub.
If the chart is plotted based on points, it shows the total sum of story points by workitem type tagged to the selected release and sprint. Similarly, if the chart is plotted based on count it shows the total number of cards, grouped by workitem type tagged to the selected release and sprint.
The chart also shows the following summary:
i) Sprint: Displays the <Sprint Name> appended by the (<Release Name>). If no sprint is selected, then it only shows the <Release Name>.
ii) Total Cards: Displays the total number of cards tagged to the selected release and sprint.