
Start with the video first to get a better grasp of the topic!
|
Skip Ahead to: |
Overview
Tile is a visual representation of data that lets you select specific values represented in tiles of equal sizes. With that, you can track large volumes of data in a limited-space Tile Chart. Every tile is associated with some data so give a title to every tile. The color of the tile indicates the range of data. You can customize the way a tile chart is displayed to best accommodate the type of data being displayed.
Interpretation
- Go to Analytics, and plot the pivot table.
- Click the More Options icon and select the Settings option. The Pivot Table dialog box opens.
- From the drop-down list, select Tile.
- To define the tile settings such as different data conditions, and color indicators, click the Settings icon next to the drop-down list.
- Add Date Range – The Date Range section provides flexible options for selecting date-based criteria and ranges:
- Select Date Criteria: Use the dropdown menu to choose how data is fetched. Options include Created on, Closed on, and Last modified on.
- Select Date Range: Choose dynamic or custom date ranges to automatically display data based on the selected period. The options include – Custom dates ( Requires additional selection of Start Date and End Date), Current month, Current quarter, Current week, Current year and many more.
- If “Custom dates” is selected, two additional dropdowns will appear to specify the Start Date and End Date.
Note: For Organization Analytics and Personal Analytics, the Date Range section will only display Start Date and End Date options.
- Add conditions, enter values, and select color indicators.

- To generate tiles for a specific value, select the attribute in the pivot and click Apply.
- Your total value will be displayed in the widget that is equal to the value of the selected criteria.
Note: Unlike other Analytics widgets, the tile can be plotted in 2/3, 3/3, and 4/3 sizes only.
When you export the Analytics page having tile charts in it, all the tiles will be shown in one page/sheet of the exported Word/excel/pdf file.
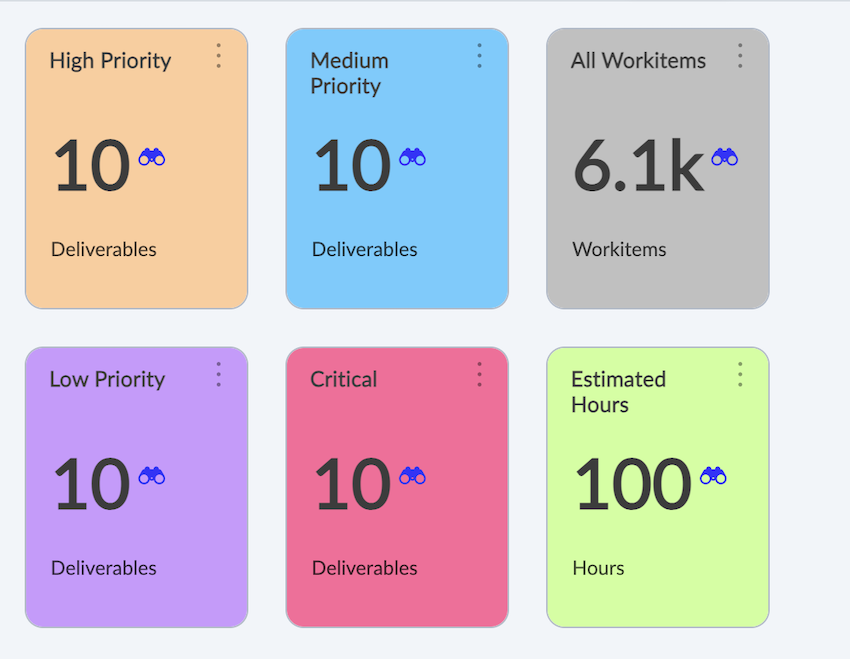
Once the Tile is plotted, you can click the Binocular icon to see the list of workitems whose count is shown on the tile. Also if the numbers are in thousands then the tile shorten the number with K. For example, the count of 12000 is shown as 12k on a small tile to accommodate data within the available space.
Key Features
- Visualize the data across workitem types.
- Select the method of summation such as Count, Sum, Average, Minimum, Maximum, 80% Upper Bound, Sum as Fraction of Total, and so on.
- Drag and drop attributes Priority, Release, Sprint, and others to the Row or Column label and render the table or chart according to your requirement.
- Drill down to the workitem level by clicking the number on the tile. The associated workitems are displayed as a list and clicking any of them will open the workitem’s Details segment.
- Export the Pivot table into Microsoft® Excel, Word, and PDF to view them offline.
Exceptions
- The Pivot table does not support the feature of saving the pivot structure in the form of reports for future use.
- Except for the Workitem Type Distribution and Testing Status Trend, all other Pivots support the table format only. So, you can generate and export the Pivot only in table format.
- The drill-down feature is not available in the exported table format.