
Start with the video first to get a better grasp of the topic!
|
Skip Ahead to: |
Overview
Workitem Analysis lets you track real-time details associated with workitems. The Workitem Analysis widget helps to monitor workitems from different perspectives such as their overall status (Open/Past Due/Closed), progress (current workflow stages), priority, and other such attributes of the workitem.
The widget displays the count of workitems as per different attributes of the workitem type. The count can be used to analyze the reasons behind the status, quality, and progress. This is vital to take appropriate action to reduce/increase the count, as applicable.
Examples of scenarios that can be plotted on the Workitem Analysis widget are:
-
Customer Reported Defects across Maintenance projects
-
Change Requests logged by Customers across various Product modules
Interpretation
Examples:
- A higher count of customers who reported defects with Reason Code as ‘Design Logic’ indicates the poor work of the Technical team.
- A lower count of closed User Requirements in a Release may indicate a backlog for the next release.
Configuration
To configure the data, you need to have an objective in mind such as:
- Which workitem types do you want to be monitored
- The projects that need focus, if you are working/managing multiple projects
- Do you need a high-level status or want to go into the details considering the various workitem attributes?
Accordingly, you can configure the widget to display data and chart to view actionable information. The widget provides various options such as Item Level Settings and Field Level Settings.
The Workitem Analytics is plotted as per the data condition values set on its settings page. To interpret a workitem analysis:
- Navigate to Analytics Builder, and plot the Workitem Analysis. The Workitem Analysis dialog box opens.
- The Setting page appear where you can specify the settings for the widget.
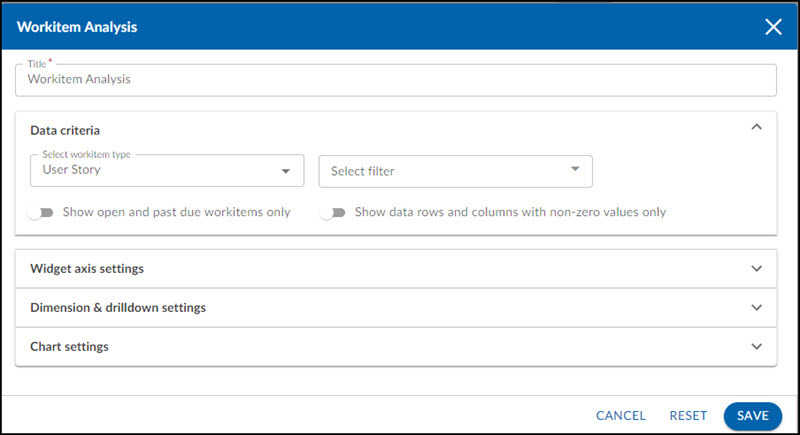
Widget name: Modify the name, if required.
Data criteria
Project Analytics (Navigation: Project name / Monitor / Analytics)
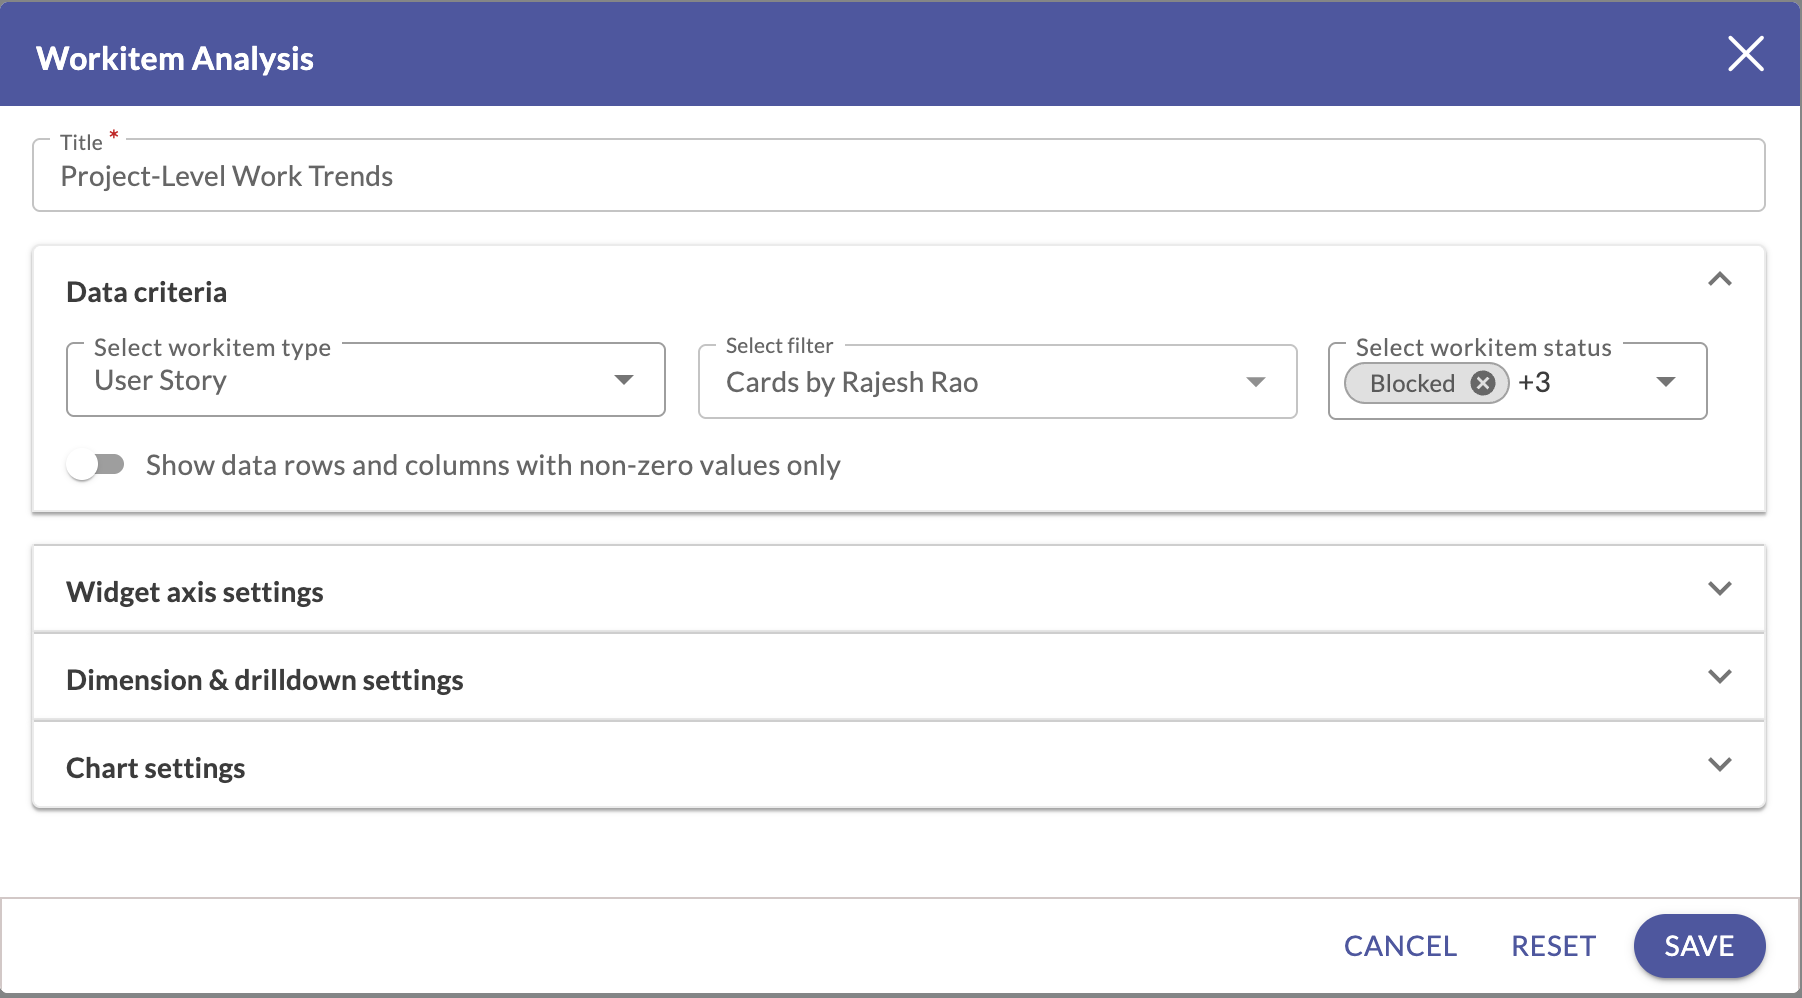
- Select workitem type: Selects the type of workitems to be displayed on the chart.
- Select filter: Displays advanced global and local filters created for the selected workitem type. The list shows only those filters that apply to the selected workitem type.
- Select workitem status: Choose the workitem statuses you want to analyze. Only workitems in the selected statuses (for example, Open, Closed, Blocked, or Past Due) are included in the results.
- Show data rows and columns with non-zero values only: Displays only rows and columns that have non-zero values, hiding empty data to reduce visual clutter.
User or Organization Analytics (Navigation: Organization name / Organization / Analytics)
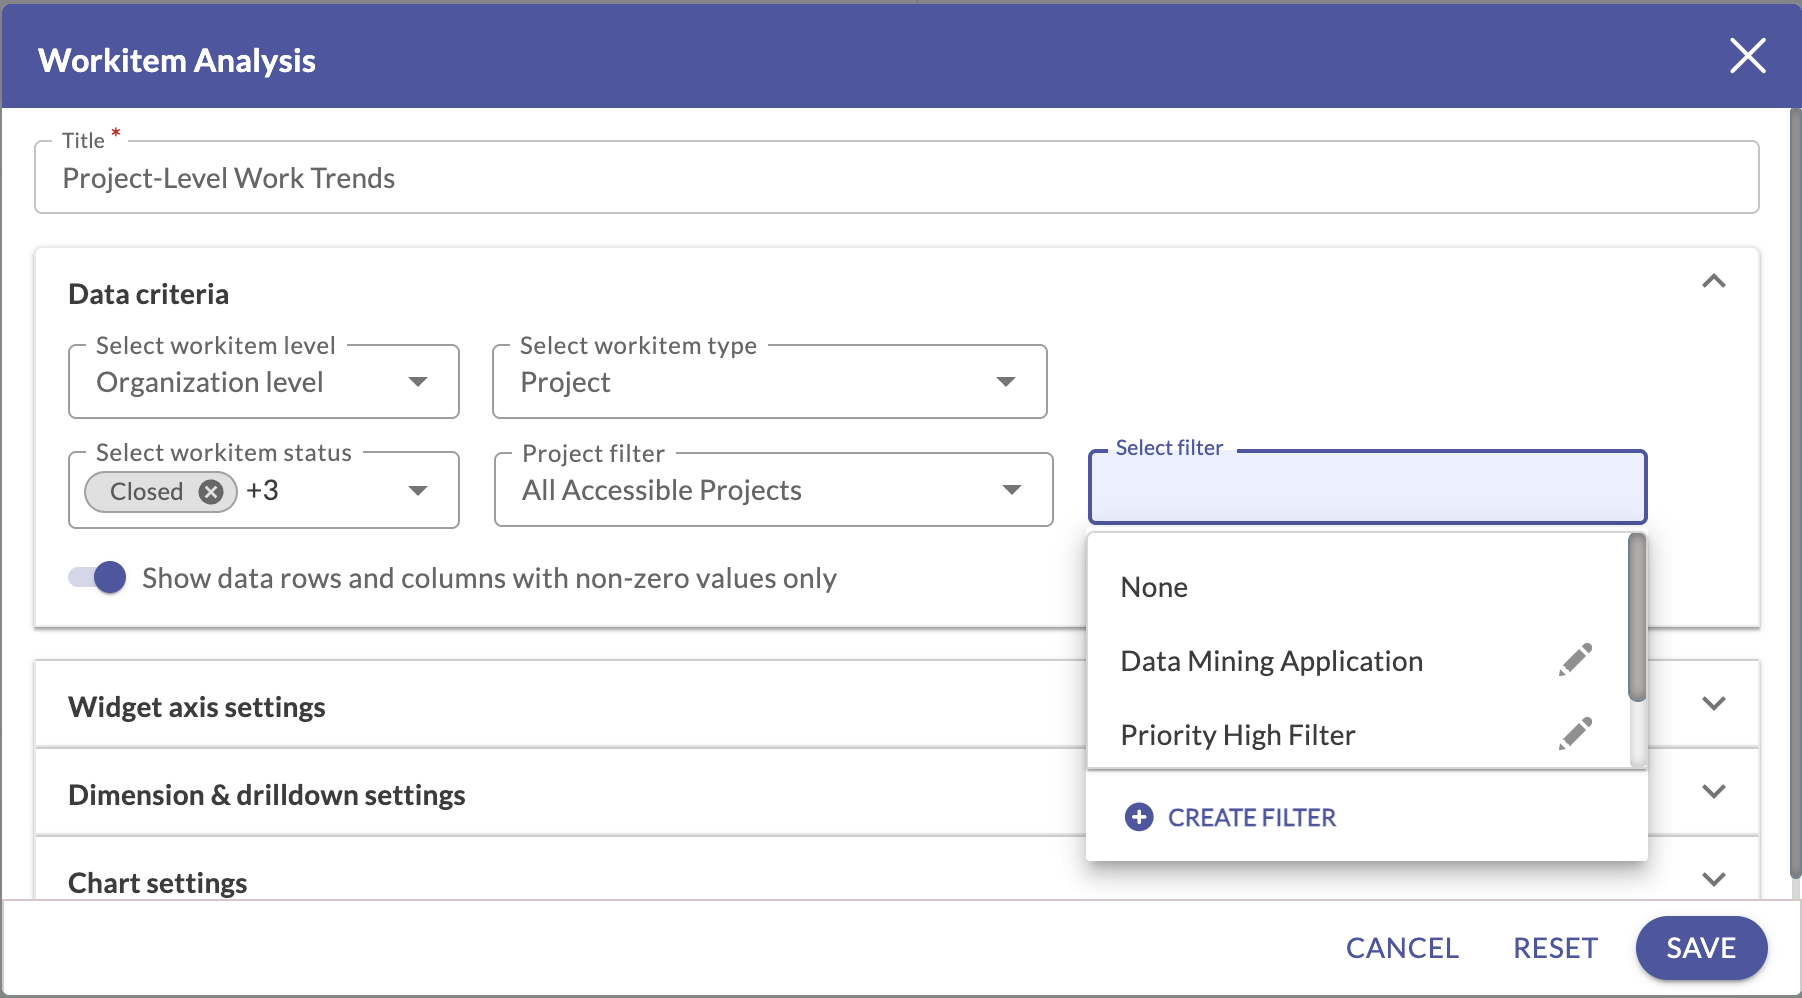
- Select workitem level: Select Organization level to choose workitem types available across the organization. Select Project level to choose workitem types available within projects.
- Select workitem status: Choose the workitem statuses you want to analyze. Only workitems in the selected statuses are included in the results.
- Select workitem type: Based on the selected level, the workitem list displays eForms with the corresponding scope. Select a workitem type to plot data for that workitem only.
- When Project level is selected, the list also includes custom eForms created across projects.
- When Organization level is selected and a project filter is applied after selecting Multiple Projects,
the list displays standard and custom eForms available at the root organization.
- When Organization level is selected, the workitem type list includes standard and custom eForms
such as Projects, Risk Library, and Reports.
- Only users with Organization creation rights can access the Organization eForm.
Note:
- Resume eForm is available when the level is Organization and the user has access
to User Skills under Resource Management.
- Activity, Phase, and Practices eForms are not available for plotting the widget.
- When Project level is selected, the list also includes custom eForms created across projects.
- Project filter:The default value is None. You can plot data for My Projects, All Accessible Projects, Dynamic Filters, or other page-level project filters.
- Select filter: Displays advanced global and local filters created for the selected workitem type. You can also create a new filter using the Create Filter option.
- Show data rows and columns with non-zero values only: Displays only rows and columns that have non-zero values, hiding empty data to reduce visual clutter.
Dimension & drill-down settings:
Workitem fields: Drag a field from the Available Categories list (Priority, Overall Status, Item Aging, and so on) and drop it into the Row or Columns text boxes. These fields will be plotted on the Chart and organized in the table view.
Project fields: Drag and drop fields such as Region, Domain, or Project Type from the Project Fields list into the Row or Columns text boxes. These fields are plotted on the chart and organized in the table view, providing insights into workitem data across projects. This enables broader insights into workitem data at the organizational level.
For example, when analyzing risks across projects in your organization, group data not only by risk-related fields but also by project-specific fields like Region, Domain, or Project Type. This helps identify the most impacted projects and make informed decisions.
The first field added to the Row or Columns box will act as the initial drill-down level. You can add multiple fields to create a hierarchical drill-down structure for deeper analysis.
In the field-level settings, some available categories are the attributes of Work Items, such as Priority, Workflow Queue, and so on. There are some other categories that indicate the behavior/ status of work Items, such as Item Aging, Time Series, and so on.
Columns
To create a drill-down Data Table, select fields and drag-drop from the Available Categories list into the Columns pane. You can create an order of drill-down by arranging them in the required sequence within the Columns box. To sequence, the drill-down, drag a field selected in the Columns box and drop it above or below a field.
When you have multiple fields in the column box selected for a drill-down, say Status and Priority, the fields will turn into links that can be clicked to drill down from Status to the Priority values.
You can have only a single field in the Row box. All possible values of the field set in the Row box are seen after the first column. For example, when you select Overall Status as a Row, Open, Past Due and Closed become the 2nd, 3rd and 4th columns. This way the count of items is shown for all available values of Overall Status as per each available value of the Priority.
Aging settings
-
Drag and drop Item Aging settings under the Columns or Row text box.
-
Click the arrow beside the Item Aging. The following are displayed:
-
Enter the values for the following fields.
• Bucket unit: Enter the unit of measurement in Year, Month, Week, or Days for measuring the age of your Workitems.
• Bucket size: Enter a value for an equivalent range for the selected Bucket Unit. For example, if your Bucket Size is 2, then the range for aging would be 0-2, 2-4, 4-6, and so on.
• Bucket count: Enter the number of columns that need to be plotted in the tabular format.
Note: The system will add one extra column along with your specified Bucket Count. The extra column will show the value greater than your Bucket Size.
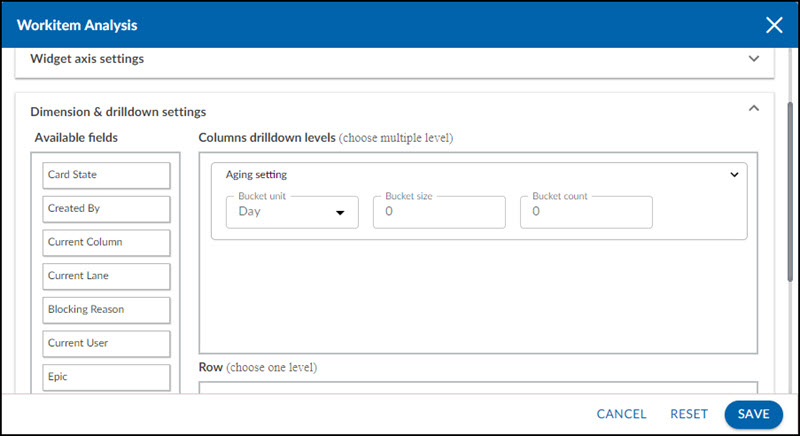
Chart settings:
- Chart Type: Select the desired chart.
- Show Data Label: It shows the data count on the data points.
- Show Trend Line: The trend line shows the linear progression across the Sprints.
Note: Multiplication of the number of columns and rows cannot be more than 1000 in a workitem analysis widget.
Best Use
The Workitem Analysis widget helps you to know the current count of workitems based on their attributes. So, workitems you would like to know the current state of, as work progresses, can be monitored through this widget.