
Start with the video first to get a better grasp of the topic!
|
Skip Ahead to: |
Overview
The Blocking Reason Analysis helps you to analyze the most common reasons for blocking the cards by the team. You can also drill down on a reason to view the workitem(s) and the number of times they are blocked for that reason. You can take corrective measures to address these reasons in the retrospective.
Note: The Blocking reason analysis can be tracked in agile project only.
The widget is plotted based on the Blocking Reason drop-down field that appears while blocking a card. By default, there are 5 blocking reasons (Insufficient Information, Resource Dependency, WIP Limit Exceeded, Task Switching, Leave). These can be updated through the master list.
Note: If the blocking reason was set as None while blocking a card, that card won’t be considered for the Blocking Reason Analysis widget.
Configuration
To plot a Blocking Reason Analysis chart, perform the following steps:
1. Open Analytics Builder and go to Standard Widgets. Click the Blocking Reason Analysis from the Agile Analytics group of metrics.
2. The Setting page appears where you can specify the settings for the widget:
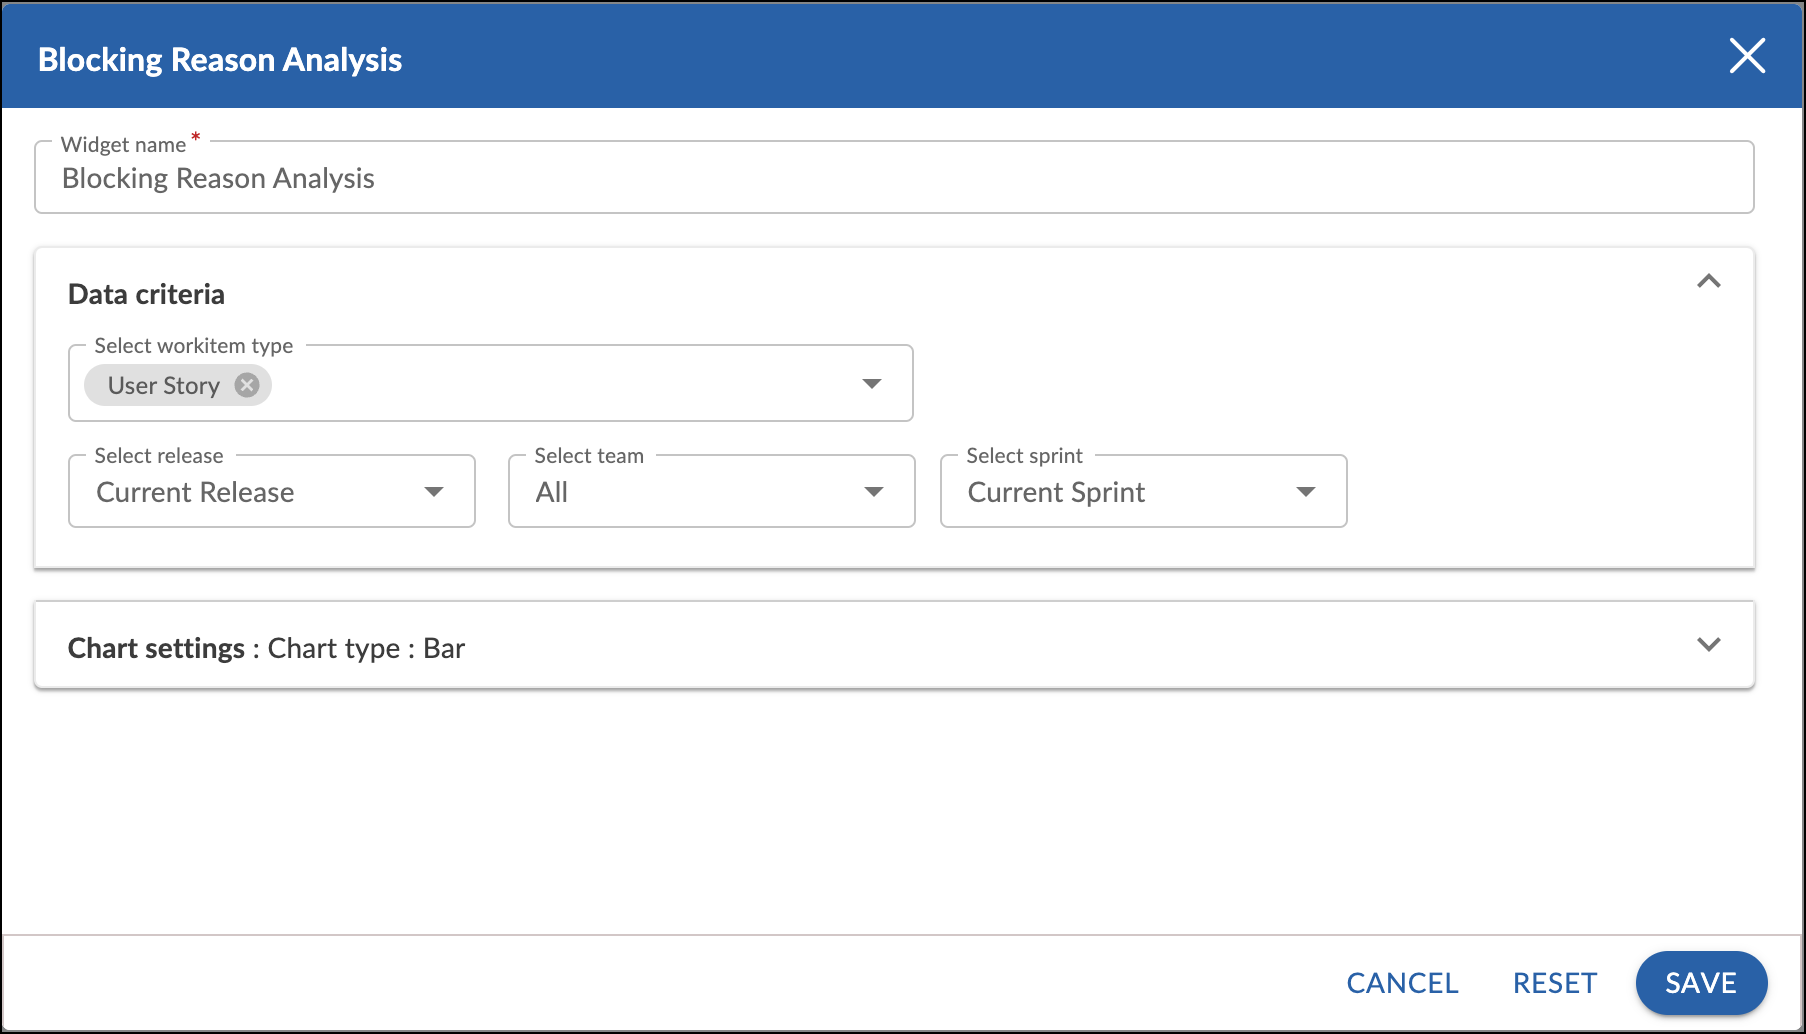
Widget name: Modify the name, if required.
Data Criteria
- Select workitem type: Selects the type of workitems from the drop-down that is to be displayed on the chart.
- Select release: Select the release for which you want to plot the blocking reason analysis widget.
- Select team: Select a team to see the sprints associated with the selected team only.
- Select sprint: Select the sprint for which you want to plot the blocking reason analysis widget.
Chart Settings
- Chart type: Select the chart type as a bar chart, line chart, pie, or donut chart to plot the widget.
- Show Data Labels: Select this option to show the labels on the chart.
Interpretation
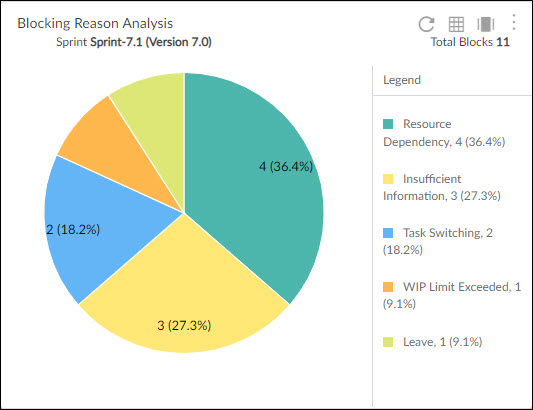
The Blocking Reason Analysis can be plotted as a pie chart, bar chart and line chart.

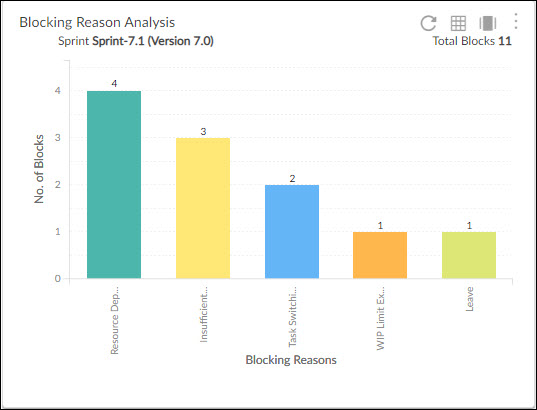
The Blocking Reason Analysis chart gives a count of the impediments caused in the sprint or release.
For each chart, Y-axis displays the number of blocks and the X-axis displays the blocking reasons.
Each bar represents the total number of times the cards were blocked for a particular reason.
For example, if UST55 was blocked 2 times due to Insufficient Information, and UST12 was blocked once by the same reason then the bar for Insufficient Information reason will show a count of 6.
The bars are plotted in descending order of the reasons and each of them is shown in unique color.
Note: The data is not based on the current set of cards that are blocked. The data is based on cards that have been blocked from the sprint start date till the current day or the sprint end date. Hence, it is possible that the card is currently unblocked but is shown in the blocking analysis count.
Clicking the bar will list the cards along with its current status and the number of times they were blocked for that reason.
Summary
1. Sprint: Shows the name of the sprint appended by the release name on which the chart has been plotted.
Note: If the sprint is set as None, then release name is shown only.
2. Total Blocks: Shows the total number of times the cards were blocked across blocking reasons within that sprint/release.