
Start with the video first to get a better grasp of the topic!
|
Skip Ahead to: |
Overview
Flow Efficiency helps you measure the actual time you have spent on a workitem. So, the efficiency is calculated based on the actual work time measured against the total wait time. The higher the percentage of Flow Efficiency, the better and smoother is the process having the ability to turn ideas or requests into a workable feature.
You can use Flow Efficiency Analytics to analyze the actual productivity time for cards, excluding the Wait Time and Blocked Time.
For example, you can measure the percentage of time spent on the cards that are typically in the In-Progress’ column type against the total time those cards spend on the board.
Calculation formula for Flow Efficiency
The calculation of flow efficiency is as follows:
Flow Efficiency in % = Work Time / ( Work Time + Wait Time)
Where,
• Work Time = Time spent by a card in the ‘In-Progress’ column types – The time the card was blocked in these columns.
• Wait Time = Blocked Time +Time spent by a card in the ‘Ready’, ‘Completed’ and ‘Done’ Column Type + Backlog Time (If backlog is selected in the filter option)
Flow Efficiency Filter
Configuration
To configure a flow efficiency chart, perform the following steps –
1. Click the Add Widget icon on the Analytics page. The Analytics Builder appears.
2. Click the SKIP button at the bottom right of the Analytics Builder to see the Standard Widgets screen.
3. From the Lean Analytics section, click the Flow Efficiency chart. The Settings page appears.
To plot the Flow Efficiency widget, specify the following information:
Data Criteria
-
Workitem type: Select the workitem type based on your requirement.
-
Start Date and End Date: Select a specific period, i.e. the Start Date and End Date from the calendar to limit the scope of chart data. View charts by selecting appropriate dates to analyze the recent performance of the team against the previous duration or the outcome of any process change. The chart considers cards that are lying in the chosen lanes/stages during that date range.
-
Select Filter: Select or create a filter to apply on the specified data.
-
Lane: Select the lane from the list box for which you want to plot the chart.
-
From andTo Column: Select the exact stages for which you want to generate by defining the Start Column and End Column. The charts consider all cards that exited the last column or have moved to or beyond Done column type and may or may not have entered the Start Column during the selected date range.
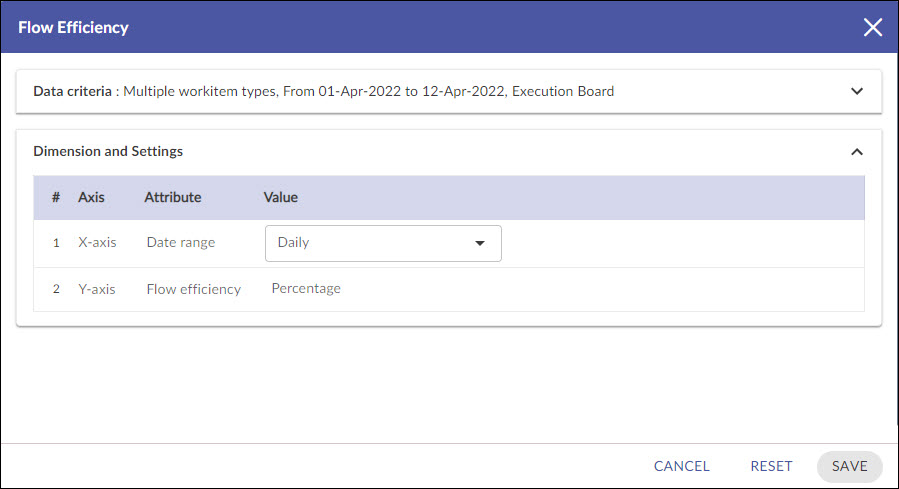
Dimensions and Settings
-
X Axis (Date Range): Snapshot of time (Daily, Weekly, Monthly, and Quarterly) for Analytics to be rolled up or unrolled on the X-axis of the chart. If you select the time unit as Weekly, then please remember that the week is considered from Sunday to Saturday.
-
Y Axis (Flow Efficiency): The flow efficiency is plotted by percentage.
Note: The charts consider the cards that have exited the End column or moved to or beyond Done column type in the date range and also cards that may have skipped the Start Column through the End Column. Flow Efficiency is calculated based on the time the card entered any column in between the Start column and the End column to the time it was moved out of the End column or have moved to or beyond Done column type.
If the End column is tagged as Done column type, then the Flow Efficiency is calculated till the card’s entry into the End column, not based on its exit from the End column.
If you select all or multiple columns for plotting the chart, then the Flow Efficiency is calculated based on the archived cards and any cards that enter into the Done column type or move beyond the Done column type.
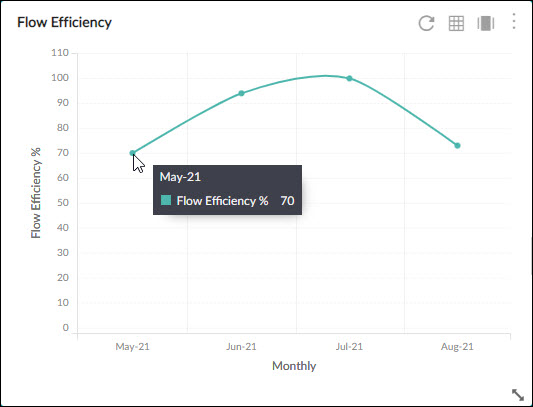
The Flow Efficiency is a smooth curve joining the non-zero data points. Hover over a data point on the vertical grid for a particular moment on the timeline on Y–axis.