
Start with the video first to get a better grasp of the topic!
|
Skip Ahead to: |
Overview
While working on a program, a program manager often works on more than one project initiative (like themes and epics). While developing objectives parallelly, it becomes challenging to keep track of their planned duration, deadline, and resources. Also, if any initiative is getting delayed, then assessing the impact of that delay becomes difficult, which may have serious repercussions on the overall objective that needs to be delivered.
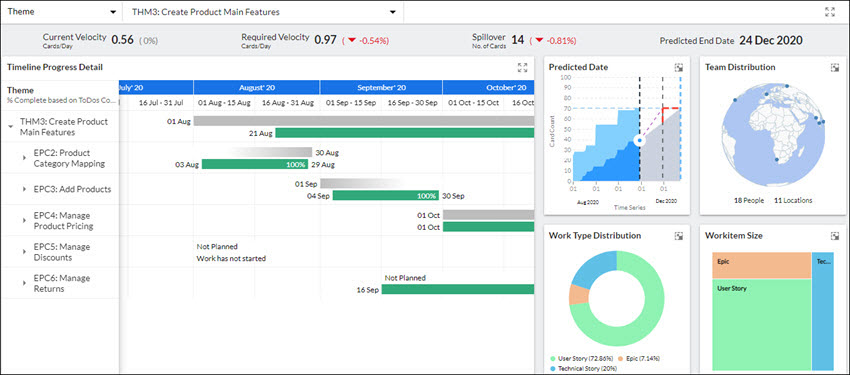
Project Health Analytics is used to monitor all important dimensions of a typical initiative and to check if the time or effort in completing the task is as per the plan. This Analytics gives you a multi-dimensional view, which helps you decide how you want to track the progress of your initiative, whether it is distributed across teams, across projects, or multiple hierarchy levels. It offers you an overview of your Theme/ Epic/Release/Sprint in terms of its progress, distribution of work, demographic information of the resources, and the relative sizing of the work involved. This makes Project Health Analytics your one-stop solution, as all the information is available under a single umbrella.
The following aspects are taken into consideration:
- Visualize if your projects are working as per the schedule in the planned roadmap. This helps in avoiding any serious repercussions caused due to the delay in development.
- Visualize the distribution of workitem types in a hierarchy. This helps you to plan out if certain workitems can be removed or added to your development cycle.
- Visualize the workitem size so that you can analyze the size of different types of workitems in a hierarchy. At a glance, you can check the workitems that are smaller or larger. This helps you to make the required adjustments by adding or removing the workitems that are difficult to get completed before the expected time.
- Visualize the impact matrix that provides information related to our current pace of work, the required pace of work, and any spillover. This helps you to be ready with a plan at any point in time during the production process to verify if the current pace of work is fine or if we need to improvise it by doing some adjustments to our plan to reach our requirements. We can also check the predicted end date of the product completion and if it is inside the range of the planned finish date or if we can expect any spillovers.
- Visualize and manage your resources. You can check how your resources are distributed to work in different locations and analyze the impact on work.
Navigation
Navigate to the breadcrumb at the top and hover over the Project name, expand the Monitor module, and select Dashboard.
Layout of Project Health
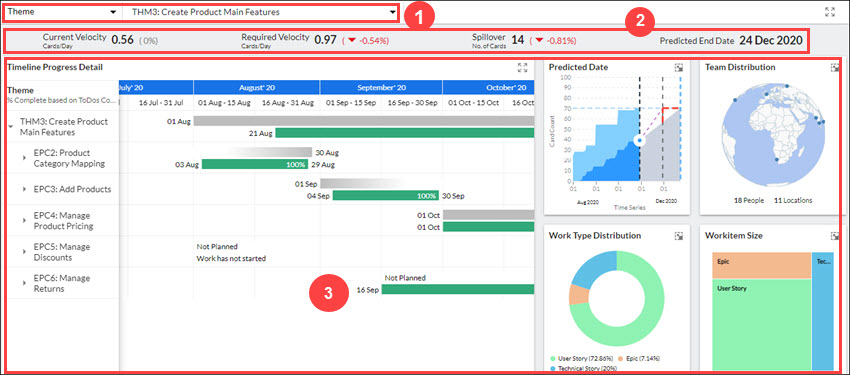
1. In the first section of the Project Health layout, you will find the filter panel. In this, you can select the Card type or Delivery Cadence, and as per your selection, you can select the instance. Depending on this selection, the second and third sections of the layout get updated.
2. The second section provides you with the impact matrix. It helps you understand how the metrics have progressed since the previous day. For each metric, you will see an increase or decrease in terms of percentage. To derive the percentage change, we will be comparing it with the previous day’s metric values.![]()
3. The four kinds of matrix values shown here are:
Current Velocity is evaluated using the formula:
![]()
Here, Total Closed Cards is the number of cards belonging to the Hierarchy or tagged to the selected Release or Sprint with the Overall Status of those cards as Closed. Also, the closed card needs to either have the same date or a date that is lesser than the current date. The Elapsed Days are the number of days between the earliest Actual Start Date and the Current Date.
The percentage change that you observe either in red or green color by the side of the current velocity is the difference between the current date value and the previous date value.
Required Velocity is evaluated using the formula:
![]()
Here, Total Open Cards is the number of cards belonging to the Hierarchy or tagged to selected Release/Sprint with the Overall Status of those cards as Open or Past Due. Remaining Days is the number of days from the Current Date till the Planned End date of the workitem or the Release/Sprint End date of the Release/Sprint tagged to the workitem.
The percentage change that you observe either in red or green color by the side of the required velocity is the difference between the current date value and the previous date value.
Spillover is evaluated using the formula:
![]()
Here, Total Open Cards is the number of cards belonging to the Hierarchy or tagged to selected Release/Sprint with the Overall Status of those cards as Open or Past Due.
The percentage change that you observe either in red or green color by the side of the current velocity is the difference between the current date value and the previous date value.
Predicted End Date is evaluated using the formula:
![]()
where,

The system calculates the projected date of completion for the workitems present in the item selected. It gives the idea that workitems will get completed on or before or after the defined release date.
4. The third and major section of the Project Health layout comprises the following five widgets: